```
██▓ ██████ ▒█████ █████▒██████ ██████
▓██▒ ▒██ ▒ ▒██▒ ██▒▓██ ▒██ ▒ ▒██ ▒
▒██░ ░ ▓██▄ ▒██░ ██▒▒████ ░▓██▄ ░ ▓██▄
▒██░ ▒ ██▒▒██ ██░░▓█▒ ░▒ ██▒ ▒ ██▒
░██████▒▒██████▒▒░ ████▓▒░░▒█░ ▒██████▒▒██████▒▒
░ ▒░▓ ░▒ ▒▓▒ ▒ ░░ ▒░▒░▒░ ▒ ░ ▒ ▒▓▒ ▒ ░ ▒▓▒ ▒ ░
░ ░ ▒ ░░ ░▒ ░ ░ ░ ▒ ▒░ ░ ░ ░▒ ░ ░ ░▒ ░ ░
░ ░ ░ ░ ░ ░ ░ ░ ▒ ░ ░ ░ ░ ░ ░ ░ ░
░ ░ ░ ░ ░ ░
```
<p align="center">
<a href="https://github.com/MenkeTechnologies/lsofrs/actions/workflows/ci.yml"><img src="https://github.com/MenkeTechnologies/lsofrs/actions/workflows/ci.yml/badge.svg" alt="CI"></a>
<a href="https://crates.io/crates/lsofrs"><img src="https://img.shields.io/crates/v/lsofrs.svg" alt="crates.io"></a>
<a href="https://crates.io/crates/lsofrs"><img src="https://img.shields.io/crates/d/lsofrs.svg" alt="downloads"></a>
<a href="https://docs.rs/lsofrs"><img src="https://docs.rs/lsofrs/badge.svg" alt="docs.rs"></a>
<a href="https://github.com/MenkeTechnologies/lsofrs/blob/main/LICENSE"><img src="https://img.shields.io/crates/l/lsofrs.svg" alt="license"></a>
</p>
> *"Rewritten in Rust. Faster. Safer. The same cyberpunk soul."*
---
## // WHAT IS THIS
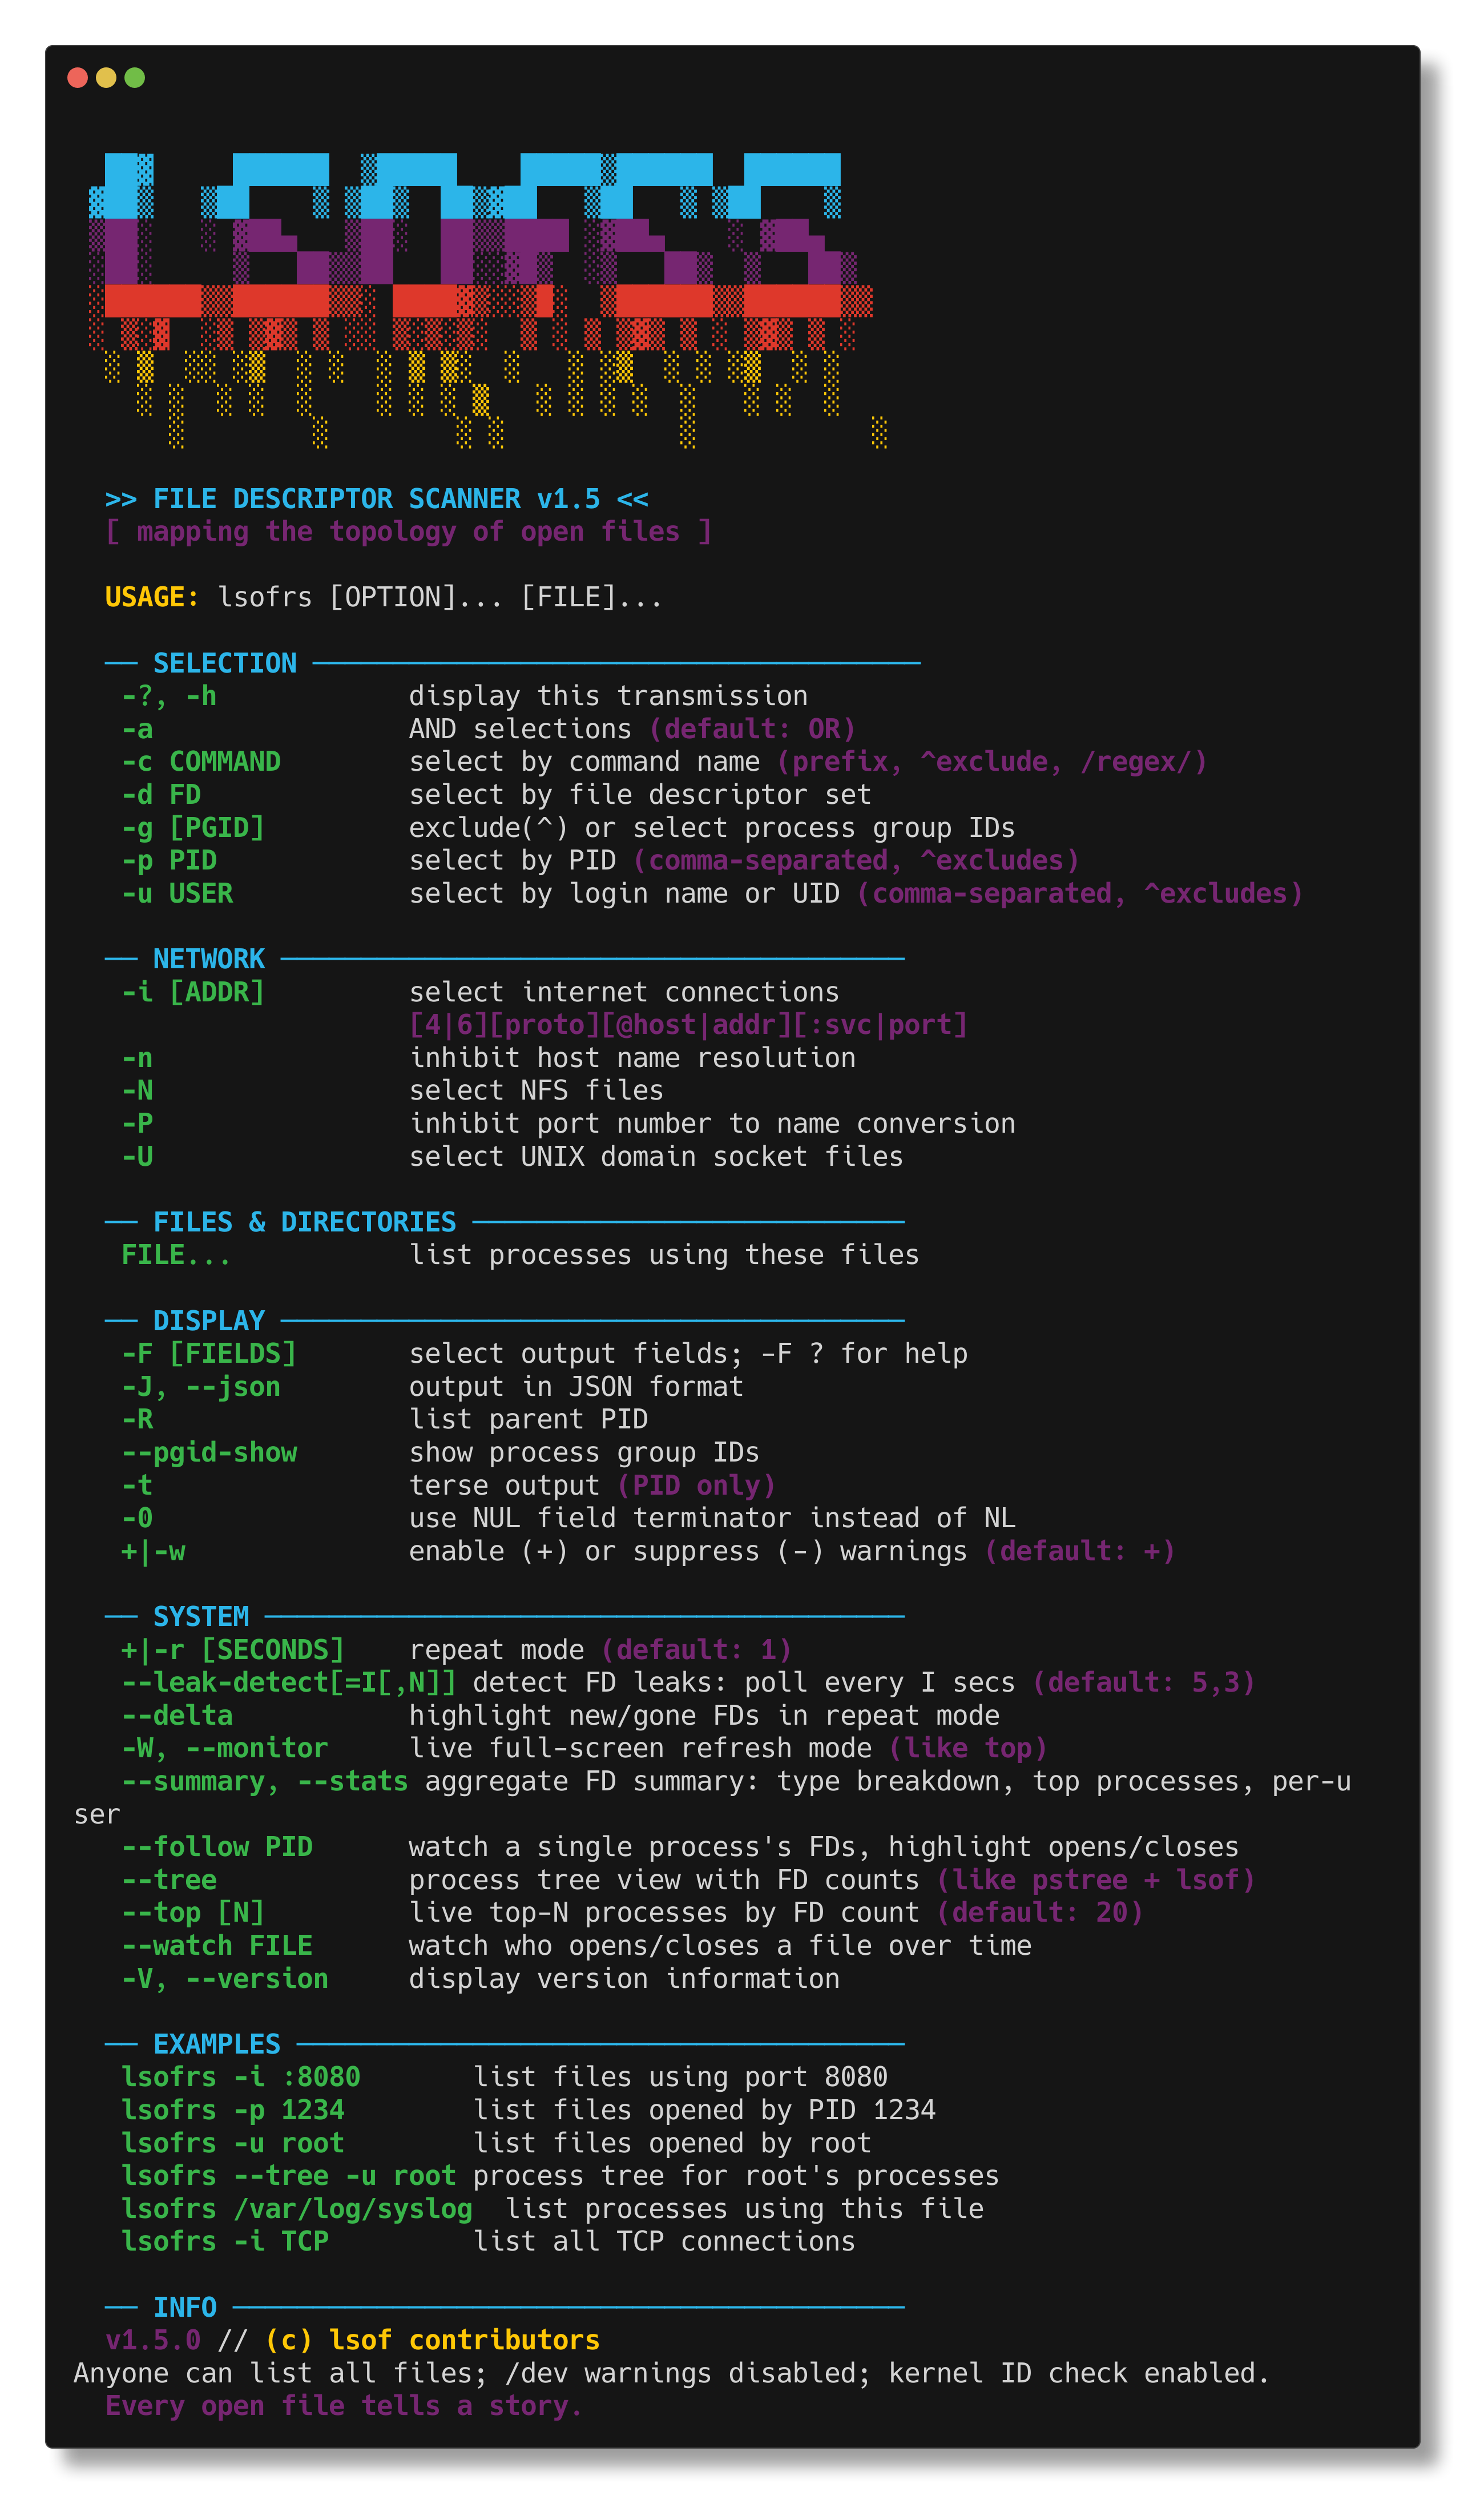
**lsofrs** — **L**ist **S**ystem **O**pen **F**iles in **R**u**s**t — v1.5.1
A Rust rewrite of [lsofng](https://github.com/MenkeTechnologies/lsofng), the modernized lsof diagnostic tool. Maps the invisible topology between processes and the files they hold open: regular files, directories, sockets, pipes, devices, kqueues — anything the kernel touches.
If a process has a file descriptor, `lsofrs` sees it.
---
## // SCREENSHOT
---
## // JACK IN — BUILD FROM SOURCE
```bash
cargo build --release
sudo cp target/release/lsofrs /usr/local/sbin/
```
Or install directly:
```bash
cargo install --path .
```
---
## // USAGE
```bash
lsofrs # list all open files
lsofrs -p 1234 # files for PID 1234
lsofrs -c Chrome # files for Chrome processes
lsofrs -u root # files for root user
lsofrs -i # network connections only
lsofrs -i :8080 # who's listening on port 8080
lsofrs /path/to/file # who has this file open
lsofrs -t -c nginx # just PIDs (for scripting)
```
### Network Filters
```bash
lsofrs -i # all network files
lsofrs -i 4 # IPv4 only
lsofrs -i 6 # IPv6 only
lsofrs -i TCP # TCP only
lsofrs -i :443 # port 443
lsofrs -i TCP:443 # TCP port 443
```
### Output Formats
```bash
lsofrs # columnar (default, cyberpunk-themed on TTY)
lsofrs --json # JSON array output
lsofrs -J # JSON (short form)
lsofrs -F pcfn # field output (p=pid, c=cmd, f=fd, n=name)
lsofrs -t # terse (PIDs only)
```
### Selection Combinators
```bash
lsofrs -p 1234,5678 # multiple PIDs
lsofrs -u root,wizard # multiple users
lsofrs -p ^1234 # exclude PID 1234
lsofrs -u ^root # exclude root
lsofrs -a -p 1234 -i # AND: PID 1234 AND network
lsofrs -d 0-10 # FD range 0-10
---
## // ADVANCED MODES
### Top-N Dashboard (`--top`)
Live auto-refreshing dashboard of the top processes sorted by FD count. Like `iotop` for file descriptors — shows FD type distribution bars, delta tracking, and per-process breakdowns.
```bash
lsofrs --top # top 20 processes by FD count
lsofrs --top 10 # top 10 only
lsofrs --top -r 5 # refresh every 5 seconds
lsofrs --top -u root # top FD consumers for root
```
**Controls**:
| `s` | Cycle sort column (FDs→PID→USER→REG→SOCK→PIPE→OTHER→DELTA→CMD) |
| `r` | Reverse sort order |
| `+`/`-` | Show more/fewer processes (±5) |
| `1`-`9` | Set refresh interval (seconds) |
| `<`/`>` | Fine-adjust refresh interval (±1s) |
| `p` | Pause/resume data collection |
| `b` | Toggle distribution bar column |
| `d` | Toggle delta column |
| `?`/`h` | Toggle help overlay |
| `q`/`Esc`/`Ctrl-C` | Quit |
### File Watch (`--watch FILE`)
Monitor who opens and closes a specific file over time. Prints timestamped `+OPEN`/`-CLOSE` events as they happen — like a lightweight `inotifywait` / `fs_usage` for a single path.
```bash
lsofrs --watch /var/log/syslog # watch syslog
lsofrs --watch /tmp/myapp.sock # watch a socket file
lsofrs --watch /dev/null -r 2 # poll every 2 seconds
```
Each event shows timestamp, open/close tag, PID, user, FD, and command. When piped, prints a single snapshot and exits.
### Process Tree (`--tree`)
Hierarchical process tree view with FD counts, type breakdowns, and network connection counts. Like `pstree` meets `lsof`.
```bash
lsofrs --tree # full process tree with FD stats
lsofrs --tree -u root # tree for root's processes
lsofrs --tree -c Chrome # tree for Chrome and helpers
lsofrs --tree --json # JSON tree with nested children
```
Each node shows: PID, user, FD count, command name, type breakdown (`[REG:12 IPv4:3 PIPE:2]`), and network connection count. Notable files (sockets, pipes) are listed inline under each process.
### Live Monitor (`--monitor` / `-W`)
Full-screen alternate-buffer display like `top(1)`. Auto-refreshes with interactive controls.
```bash
lsofrs --monitor # full-screen monitor
lsofrs -W -r 2 # refresh every 2 seconds
lsofrs -W -c Chrome # monitor Chrome only
```
**Controls**: `s`=sort, `r`=reverse, `f`=filter, `p`=pause, `?`=help, `q`=quit
### Follow Mode (`--follow PID`)
Watch a single process's FDs in real-time. New opens highlighted `+NEW` in green, closes `-DEL` in red.
```bash
lsofrs --follow 1234 # watch PID 1234
lsofrs --follow 1234 -r 2 # 2-second refresh
```
### FD Leak Detection (`--leak-detect`)
Monitors per-process FD counts over time. Flags processes with monotonically increasing FD counts.
```bash
lsofrs --leak-detect # default: 5s interval, 3 increase threshold
lsofrs --leak-detect=10,5 # 10s interval, flag after 5 consecutive increases
lsofrs --leak-detect -u wizard # monitor only wizard's processes
```
### Summary / Statistics (`--summary`)
Aggregate FD breakdown with bar charts, top processes, per-user totals.
```bash
lsofrs --summary # text report
lsofrs --summary --json # JSON report
lsofrs --summary -i # network-only summary
```
### Delta Highlighting (`--delta`)
Color-code changes between repeat iterations. New FDs in green, gone in red.
```bash
lsofrs --delta -r 2 # repeat every 2s with change highlighting
lsofrs --delta -r 1 -c myapp # watch myapp changes
```
---
## // CYBERPUNK THEME
When output goes to a TTY, lsofrs activates cyberpunk-themed column headers and ANSI coloring:
| COMMAND | PROCESS |
| PID | PRC |
| USER | H4XOR |
| TYPE | CL4SS |
| DEVICE | DEV/ICE |
| SIZE/OFF | BYT3/0FF |
| NODE | N0DE |
| NAME | T4RGET |
When piped or redirected, plain headers and no colors are used — safe for scripts.
---
## // ARCHITECTURE
```
src/
├── main.rs # CLI entry point, dispatch, repeat/leak-detect loops
├── cli.rs # clap argument definitions + custom help display
├── types.rs # Core data structures (Process, OpenFile, SocketInfo, etc.)
├── darwin.rs # macOS libproc FFI — process/FD enumeration
├── filter.rs # Selection & filtering (PID, user, command, FD, network)
├── output.rs # Columnar & field output formatting, ANSI theming
├── json.rs # JSON serialization via serde
├── monitor.rs # Live full-screen mode (crossterm alternate screen)
├── follow.rs # Single-process FD tracking with status transitions
├── leak.rs # Circular-buffer leak detector
├── delta.rs # Iteration-diff engine for change highlighting
├── summary.rs # Aggregate statistics with bar charts
├── tree.rs # Process tree view with FD inheritance
├── top.rs # Live top-N FD dashboard with delta tracking
└── watch.rs # File watch — monitor opens/closes over time
completions/
└── _lsofrs # Zsh completion function
```
### Shell Completions
Zsh completions are provided in `completions/_lsofrs`. To install:
```bash
cp completions/_lsofrs /usr/local/share/zsh/site-functions/
# or symlink into your fpath
ln -sf "$PWD/completions/_lsofrs" /usr/local/share/zsh/site-functions/_lsofrs
# then reload
autoload -Uz compinit && compinit
```
### Platform Support
Currently targets **macOS/Darwin** via the `libproc` API (`proc_listpids`, `proc_pidinfo`, `proc_pidfdinfo`). The architecture is designed for dialect extension — Linux (`/proc` filesystem), FreeBSD, etc. can be added as platform-specific modules behind `#[cfg(target_os)]`.
### Key Design Decisions
- **Zero-copy FFI**: Raw `repr(C)` structs matched to Darwin kernel headers. No intermediate parsing.
- **Streaming output**: Processes are gathered, filtered, and printed in a single pass.
- **crossterm for TUI**: Alternate screen buffer, raw mode, cursor control — no ncurses dependency.
- **serde for JSON**: Derive-based serialization, no hand-rolled escaping.
- **clap for CLI**: Derive-based argument parsing with full help generation.
---
## // PERFORMANCE
Benchmarked on macOS with `hyperfine` (10 runs, 3 warmup, ~550 processes / ~5800 open files):
### All Open Files (default)
| **lsofrs** (Rust) | **73 ms** | 50–117 ms | 17 ms | 32 ms |
| lsof 4.91 (C) | 274 ms | 225–344 ms | 108 ms | 100 ms |
| lsofng (C) | 5630 ms | 5223–8302 ms | 109 ms | 116 ms |
| lsof (system) | **3.7x** faster |
| lsofng | **76.8x** faster |
### Network Connections (`-i TCP`)
| **lsofrs** | **89 ms** | 30–307 ms | 4 ms | 14 ms |
| lsof 4.91 | 157 ms | 105–345 ms | 69 ms | 20 ms |
| lsofng | 5246 ms | 5103–5602 ms | 70 ms | 21 ms |
| lsof | **1.8x** faster |
| lsofng | **58.9x** faster |
### Terse Output (`-t`, PIDs only)
| **lsofrs** | **46 ms** | 18–124 ms | 4 ms | 14 ms |
| lsof 4.91 | 211 ms | 139–474 ms | 53 ms | 90 ms |
| lsofng | 253 ms | 172–492 ms | 52 ms | 104 ms |
| lsof | **4.6x** faster |
| lsofng | **5.5x** faster |
### Structured Output (`-J` JSON / `-F` field)
| **lsofrs** `-J` | **126 ms** | 63–223 ms | 16 ms | 36 ms |
| lsof `-F pcfn` | 231 ms | 186–488 ms | 89 ms | 89 ms |
| lsofng `-J` | 244 ms | 159–414 ms | 59 ms | 103 ms |
| lsof | **1.8x** faster |
| lsofng | **1.9x** faster |
Most wall-clock time is spent in kernel syscalls (`proc_pidinfo`), which are identical between implementations. The Rust version's advantage comes from zero-copy FFI, efficient memory allocation, and lower user/system CPU overhead (6.4x less user CPU than lsof, 3.1x less system CPU).
---
## // LICENSE
MIT License — Jacob Menke
---
## // CREDITS
Rust rewrite of [lsofng](https://github.com/MenkeTechnologies/lsofng) by Jacob Menke, which itself is a modernized fork of the original [lsof](https://github.com/lsof-org/lsof) by Vic Abell.