# Lobe
**Local HTTP performance profiling for developers.**
See exactly where every request spends its time. DNS, TCP, TLS, TTFB, and download phases captured against grounded network baselines — so you know when something is *actually* slow versus just fine.
- Zero-config local proxy — no agent to install, no APM to configure
- Works with any language, framework, or mobile app you already run
- Free tier runs entirely on your machine — no account required
- Optional cloud sync for historical baselines and cross-session diffing
Learn more at [getlobe.dev](https://getlobe.dev), or jump to the [FAQ](https://getlobe.dev/faq) — HTTPS handling, what stacks it supports, how it splits TTFB, its own proxy overhead, and what `lobe explain` sends.
## Install
Two paths, whichever fits your setup.
```bash
# macOS + Linux via Homebrew
brew install kpwithcode/lobe/lobe
# Any platform with the Rust toolchain (macOS, Linux, Windows, WSL, Alpine, …)
cargo install lobe-cli
```
Verify:
```bash
lobe --version
```
No account required to run any of the CLI commands below.
## Quickstart
Point Lobe at a local dev server and route traffic through it:
```bash
lobe capture http://localhost:3000
```
That spins up a local proxy on `http://127.0.0.1:7878` by default (configurable via `--listen`). Open that URL in your browser instead of `localhost:3000` — every request through it gets its DNS, TCP, TLS, TTFB, and download phases recorded.
Inside the TUI:
- `q` — quit
- `e` — export the current session to `/tmp/lobe-capture-session-*.json`
- `u` — upload session to your Lobe account (requires `lobe login` first — see [Cloud sync](#cloud-sync-optional))
## What you'll see
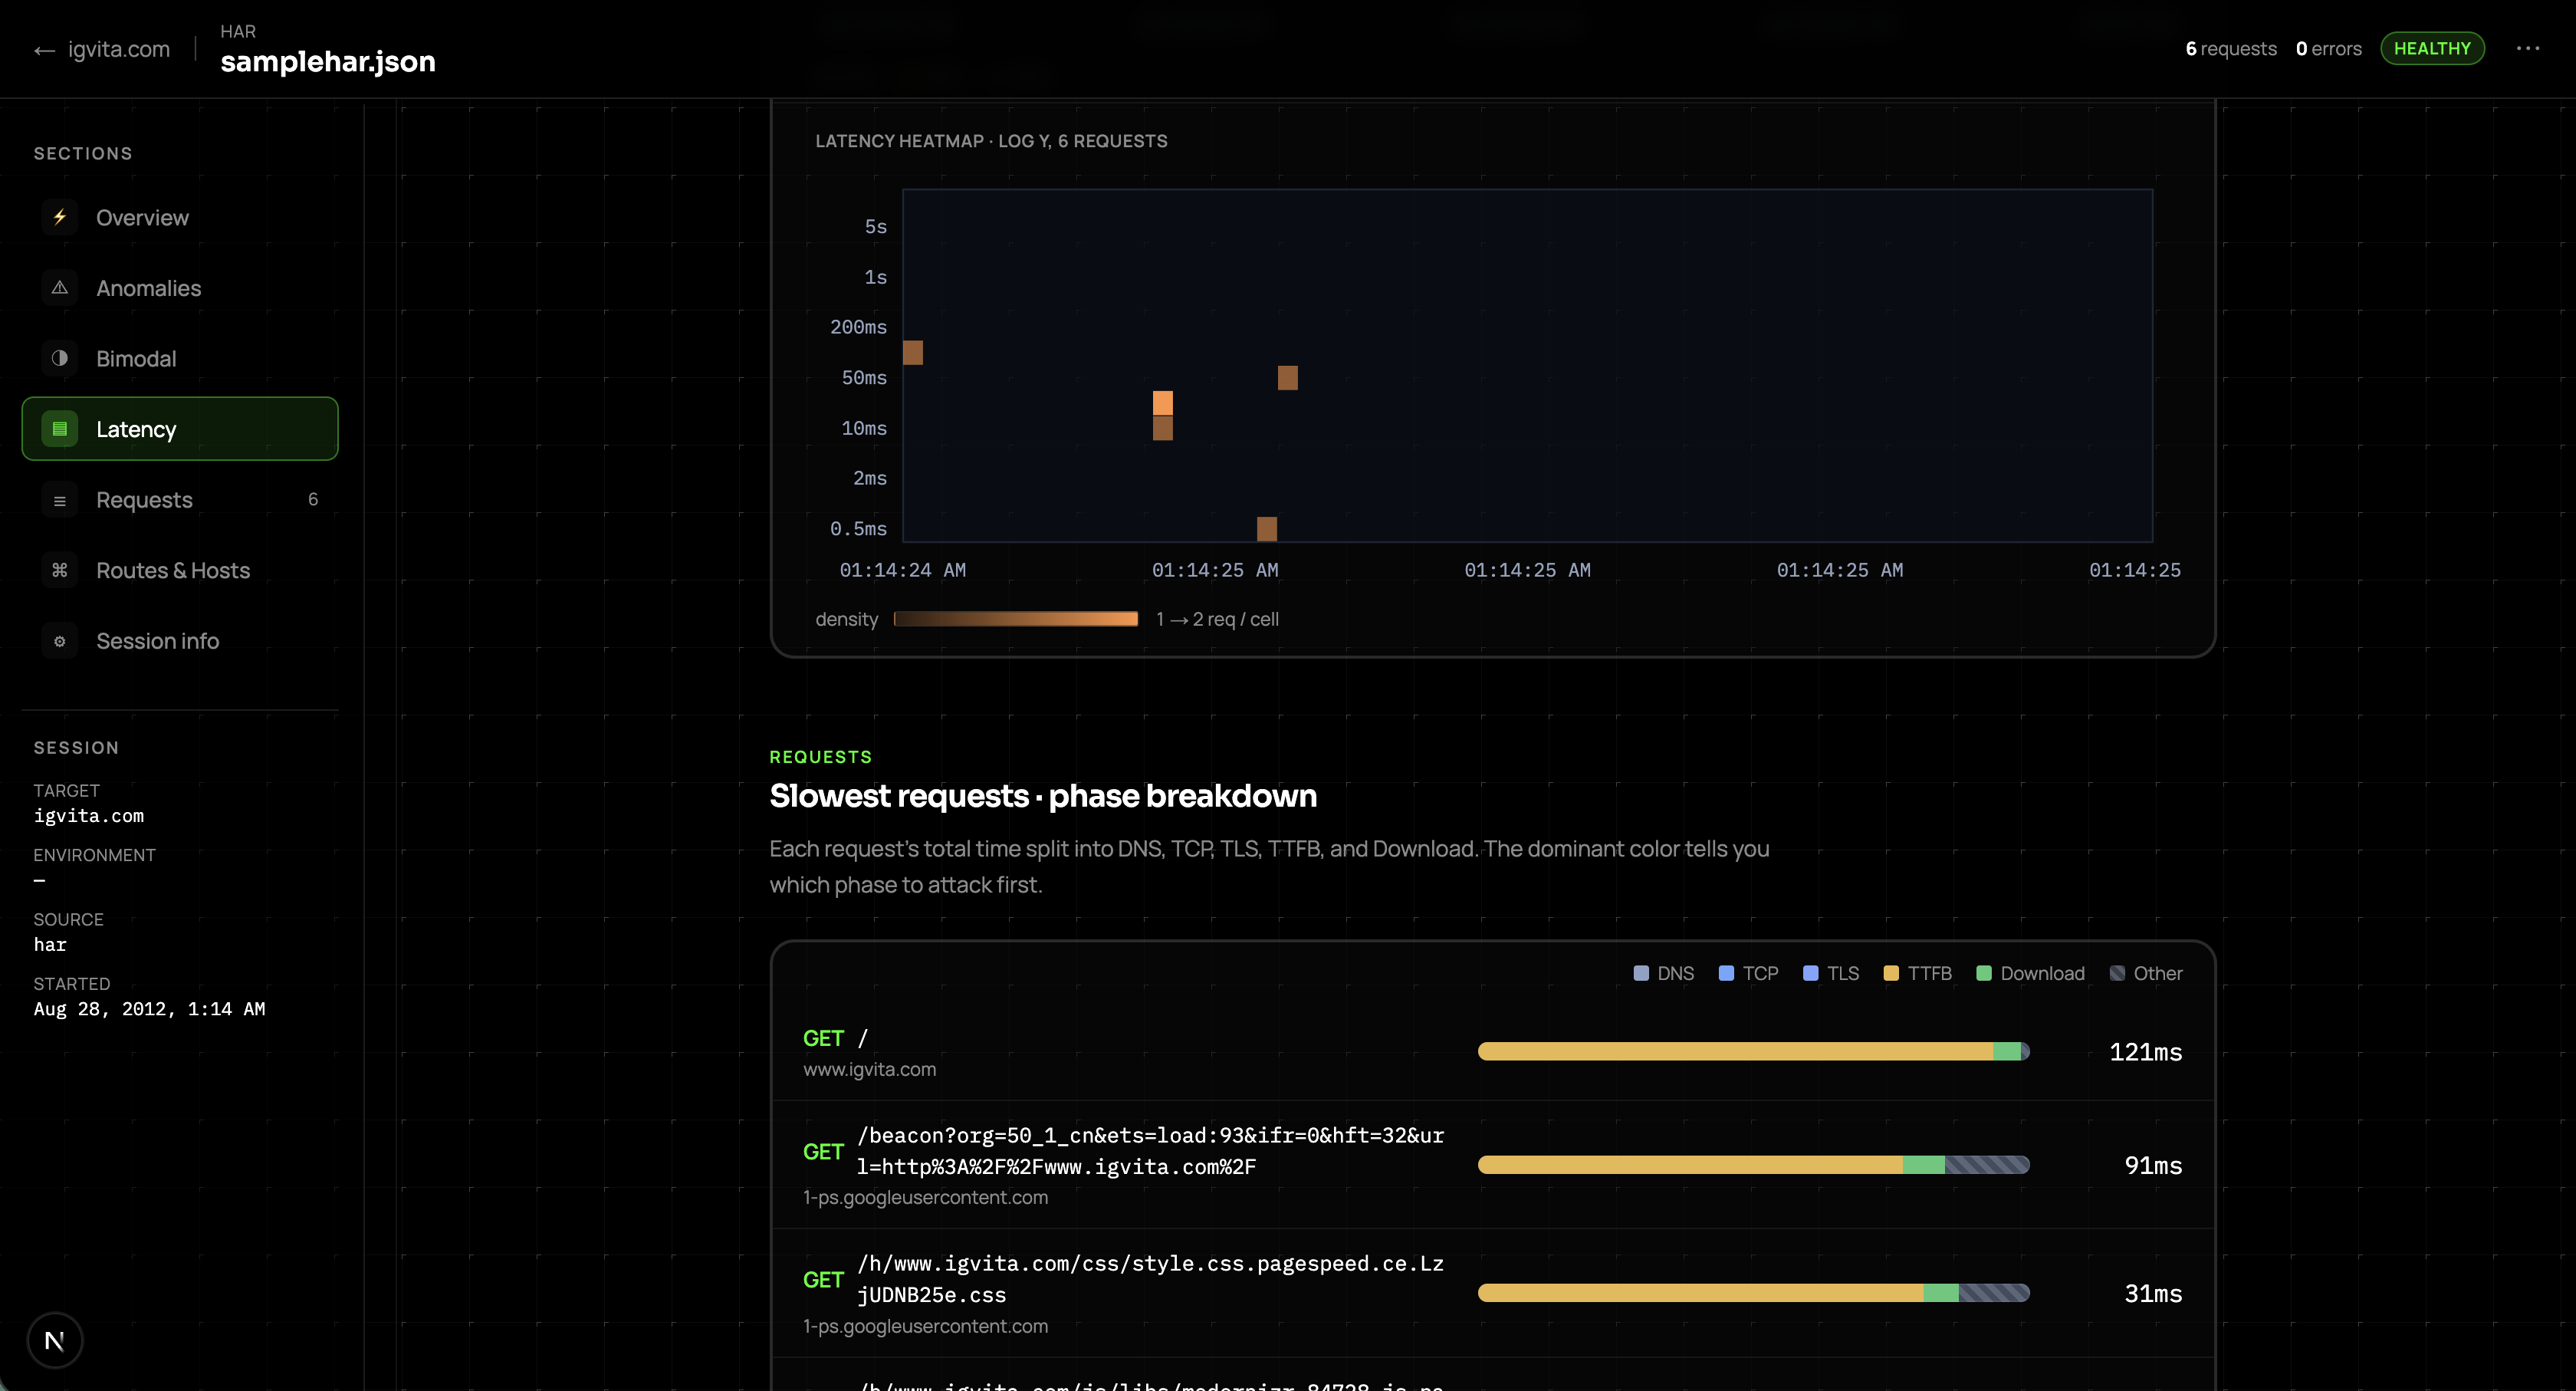
Each request is broken into five phases — **DNS**, **TCP**, **TLS**, **TTFB**, and **Download** — rendered as a color-coded bar, so the phase to attack first is obvious at a glance. Lobe judges each phase against grounded baselines for where it's running (loopback, LAN, remote) and **flags the ones that overshoot** — a 400ms TLS handshake gets called out, while a 4ms multiplexed request doesn't trip a false "impossibly fast" alarm. It also measures and prints its own proxy overhead per session (e.g. `proxy +0.05ms`), so you can trust the phase numbers reflect your upstream, not Lobe.
<!-- Capture-TUI shot to slot in later (rebuild the CLI first so the summary line shows `proxy +…ms`):
 -->
## Two modes
Lobe has two capture flavors. Use whichever matches the question you're trying to answer.
### `lobe capture <upstream>`
Real request traffic routed through a local proxy. Best for answering *"why is this page slow when I click around?"* Every request the app makes flows through Lobe, and every phase is recorded.
```bash
lobe capture http://localhost:3000
```
### `lobe watch <url>`
Synthetic probing of a single URL on an interval. Best for answering *"is this endpoint drifting?"* or *"is my baseline still good after this deploy?"*
```bash
lobe watch https://api.example.com/health --tui
```
## It's fast for one request — what about 50 at once?
A single probe tells you *unloaded* latency. `lobe probe --concurrency` tells you what happens under contention — where a connection pool or worker pool falls over, and which phase blows up when it does.
```bash
# hold 50 requests in flight, 200 total, full phase timing on each
lobe probe https://api.example.com/users --concurrency 50
# sweep to find the level where it falls over
lobe probe https://api.example.com/users --concurrency 1,5,10,25,50
```
Each level reports p50/p95 per phase, and the sweep renders TTFB vs concurrency so the cliff is obvious:
```text
── ttfb vs concurrency ──
conc p50 p95
1 42ms 47ms ███
5 43ms 602ms ████████████████████████████
25 46ms 607ms ████████████████████████████ ← bimodal
bimodal ttfb: fast cohort 43ms ×81 (54%) / slow cohort 604ms ×69 (46%) — 14.0× split
```
When TTFB splits into a fast and a slow cohort like that, a bounded resource is saturated — the classic case is a DB connection pool: the fast cohort got a connection, the slow cohort queued. Lobe detects the split and prints it; you don't have to eyeball a histogram.
Notes:
- **This is a diagnostic, not a load-testing tool.** It reports latency distributions, not requests/second — for throughput benchmarking use k6 or wrk.
- **Bursts default to GET** (HEAD is also allowed). Flooding a mutating endpoint requires an explicit `--method POST --allow-unsafe`, because 200 concurrent POSTs execute 200 real mutations.
- `--requests N` controls total volume per level (default 200).
## Capturing a local web app
```bash
lobe capture http://localhost:5173 --listen 127.0.0.1:7878
```
Then browse through the proxy at `http://127.0.0.1:7878` instead of `localhost:5173` directly.
Two details worth knowing:
- **`localhost` vs `127.0.0.1` is not interchangeable.** Match whatever your app normally answers on — different hosts, different DNS paths.
- **Change the proxy port** with `--listen 127.0.0.1:9090` if `7878` is already taken.
## Capturing a mobile app
Put Lobe on your machine's LAN IP so your phone can reach it. The mobile app talks to the proxy; the proxy forwards upstream to your real backend on its normal port.
```bash
lobe capture http://192.168.1.169:8000 --listen 0.0.0.0:7878
```
Then point the mobile app at the proxy:
```ts
const DEV_API_URL = "http://192.168.1.169:7878";
```
**Do not** move your backend to `7878`. Keep it on `8000` (or wherever it already runs). The app calls `7878`, Lobe forwards to `8000`. Use your machine's LAN IP, not `localhost` — a physical phone can't resolve `localhost` back to your laptop.
For a desktop browser on the same machine, `127.0.0.1` is fine. For a phone, simulator, or device on the network, use the LAN IP.
## Exporting sessions
While a `capture` or `watch` session is running, press `e` to export it as JSON:
```text
/tmp/lobe-capture-session-YYYYMMDD-HHMMSS.json
```
Exports can be replayed offline, shared with a teammate, or fed into `lobe explain` for an AI-generated triage report (see below).
## Cloud sync (optional)
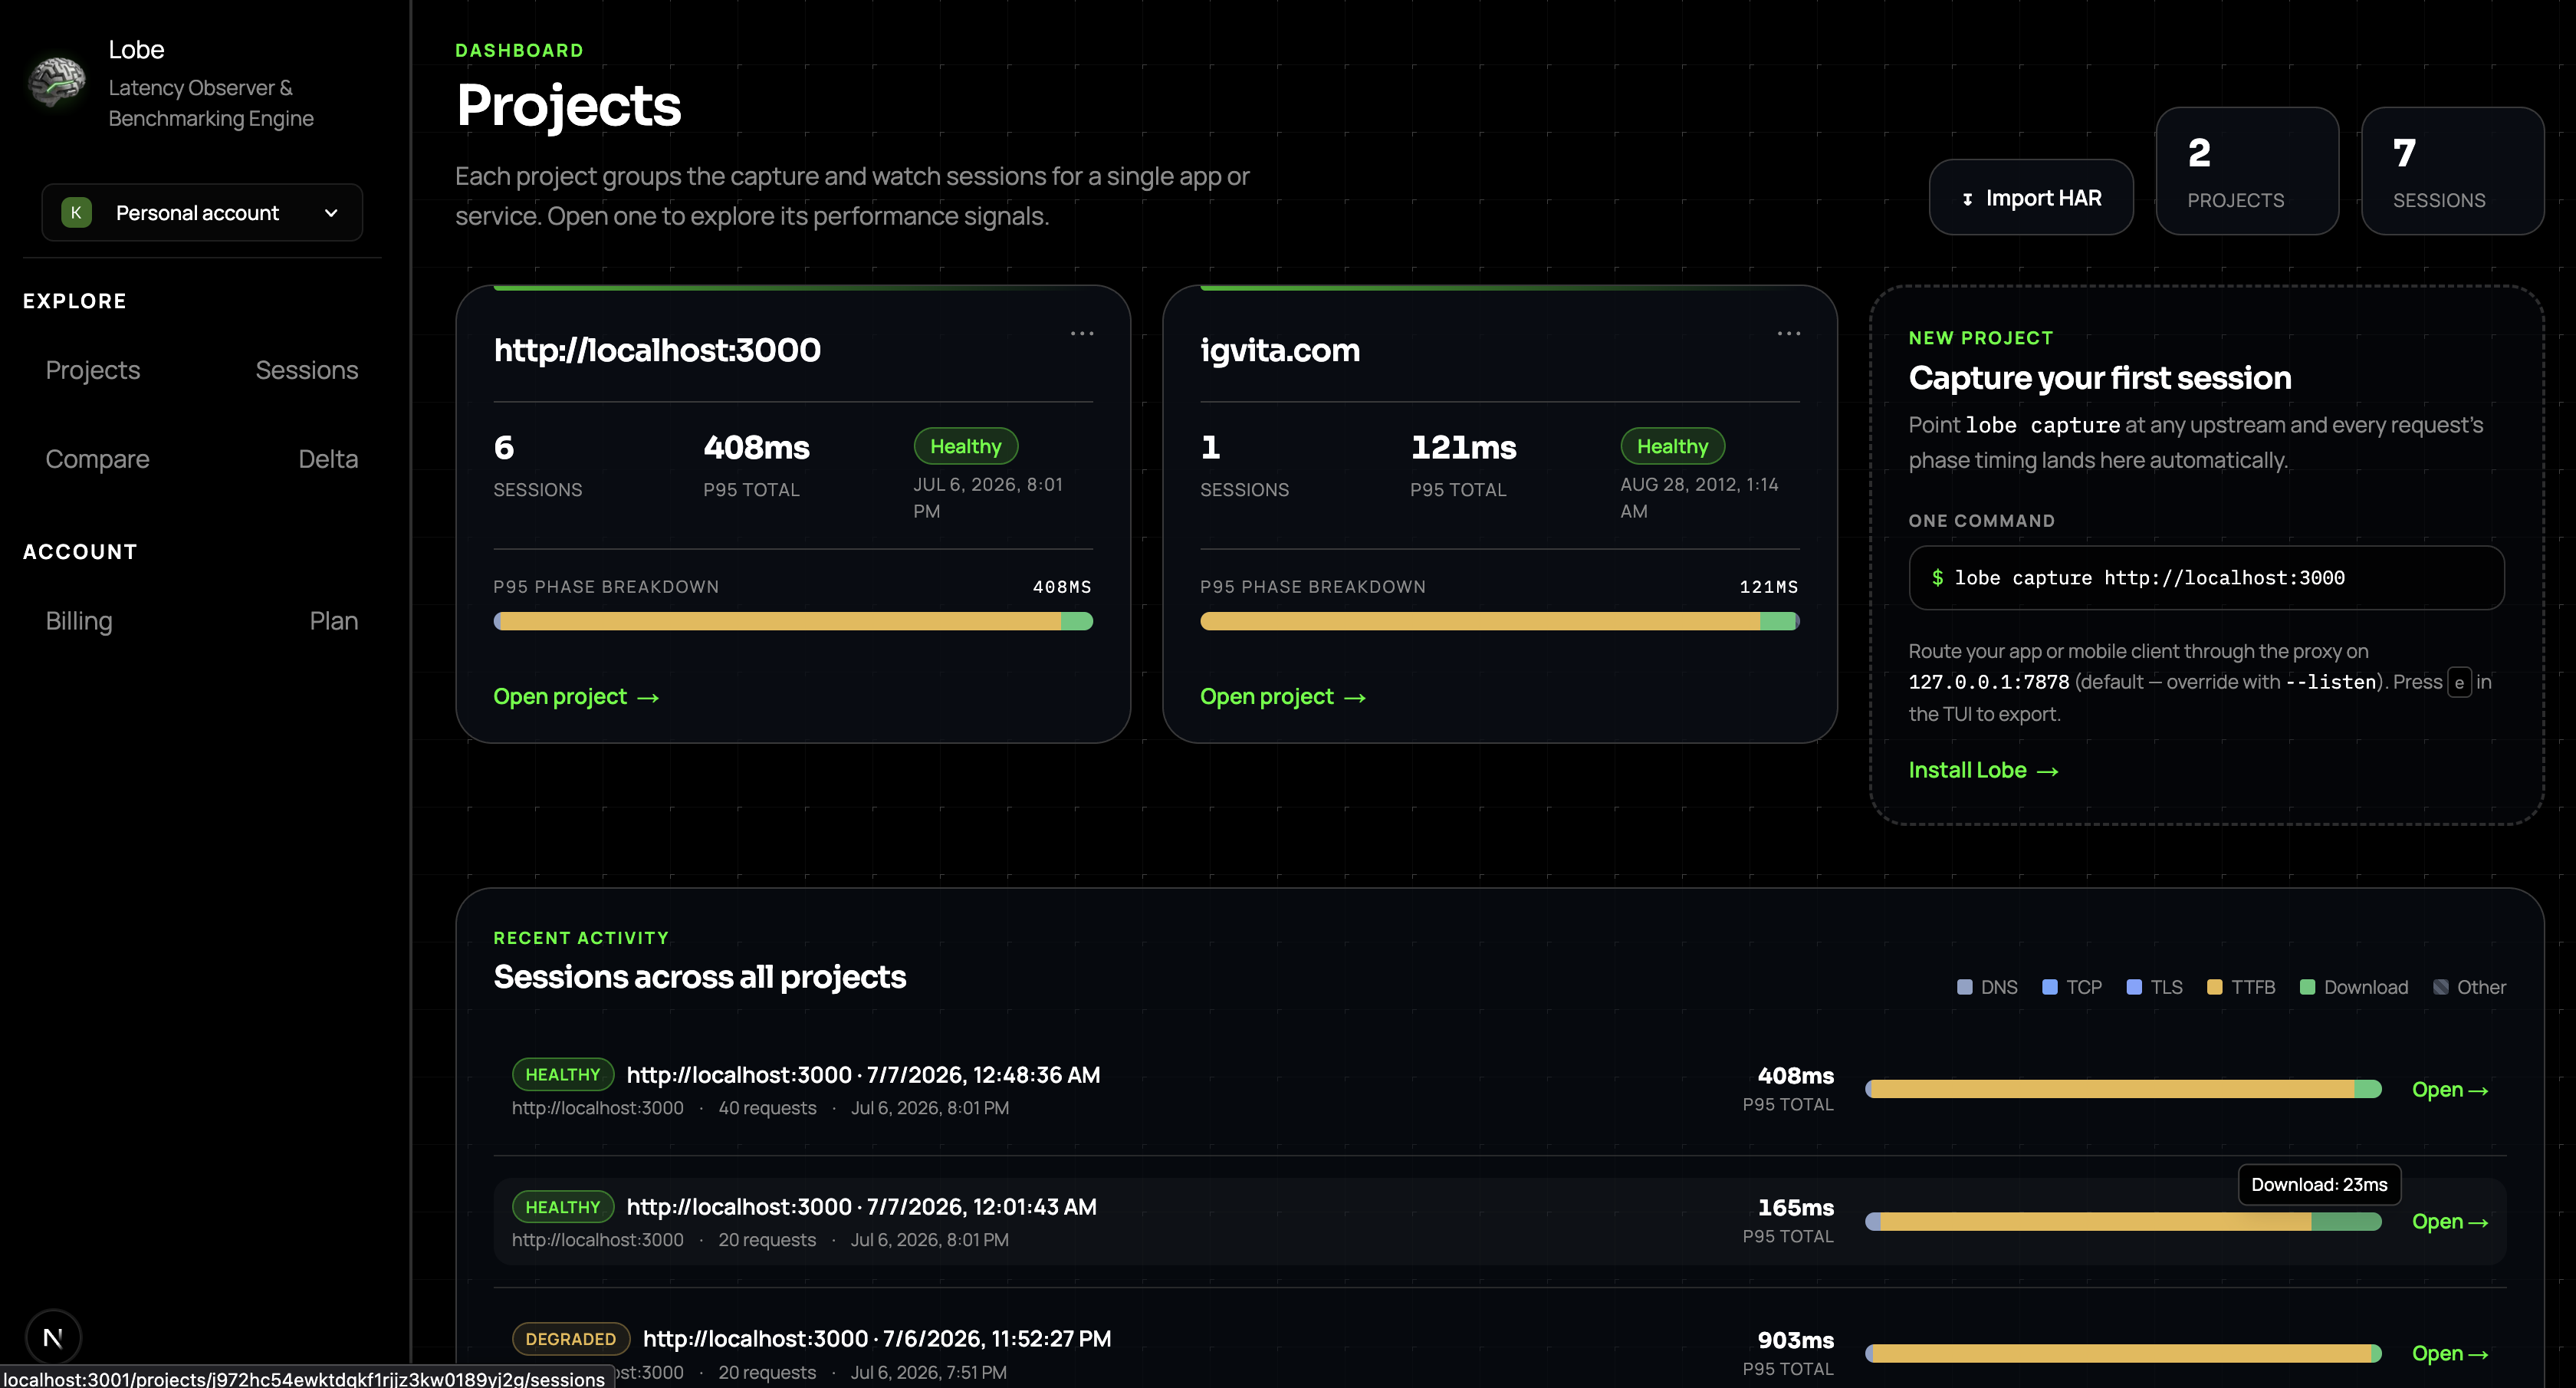
Everything above runs locally with no account. If you want your sessions to **persist** — for historical baselines, cross-session diffs, and sharing with teammates — sync them to the hosted dashboard:
1. Create a free account and sign in at [getlobe.dev](https://getlobe.dev).
2. Mint a CLI token at [getlobe.dev/cli-auth](https://getlobe.dev/cli-auth) and copy the `lobe_...` value.
3. Authorize this machine — the CLI defaults to the hosted service, so there are no URLs to configure:
```bash
lobe login --token lobe_YOUR_TOKEN
```
4. Capture with upload enabled, or just press `u` any time inside the TUI:
```bash
lobe capture http://localhost:3000 --upload
```
Your sessions then appear under **Projects** on the dashboard, auto-grouped by upstream, with the same phase breakdowns and baseline anomalies you see in the TUI.
## Seeing inside TTFB (Server-Timing)
A proxy can't see inside your server — TTFB is one opaque number. But if your app emits the standard [`Server-Timing`](https://developer.mozilla.org/en-US/docs/Web/HTTP/Headers/Server-Timing) response header, Lobe splits the TTFB bar into your app's own segments (db, render, …), with any remainder shown as unattributed `app` time. No agent, works in any language — it's one middleware line:
```js
// Express
res.setHeader("Server-Timing", `db;dur=${dbMs}, render;dur=${renderMs}`);
```
```python
# Django
response["Server-Timing"] = f"db;dur={db_ms}, view;dur={view_ms}"
```
Rails emits it automatically in development (`ActionDispatch::ServerTiming`), so Rails apps get the split for free.
## AI-powered analysis
Lobe ships two flavors of AI diagnosis. Both are optional.
### Option 1 — `lobe explain` (CLI, any editor)
Runs from the command line against a capture export. Reads your `ANTHROPIC_API_KEY` env var, sends a summarized session to Claude Haiku 4.5 (~$0.07/call), and prints a markdown report applying the USE method.
```bash
export ANTHROPIC_API_KEY=sk-ant-...
lobe explain /tmp/lobe-capture-session-*.json
lobe explain --model sonnet /path/to/session.json # deeper pass
lobe explain --output report.md session.json
```
### Option 2 — Claude Code / Cursor skill (no key needed)
If you already use Claude Code or Cursor, use the shipped skill and let *your* editor's AI do the diagnosis — no additional API key, no additional cost beyond what you're already paying for Claude Code / Cursor.
**One-liner install (bundled in the CLI binary):**
```bash
# from any project directory
lobe install-skill claude-code # writes .claude/skills/lobe-diagnose/SKILL.md
lobe install-skill cursor # writes .cursor/rules/lobe-diagnose.mdc
# or install globally for all your projects
lobe install-skill claude-code --global
lobe install-skill cursor --global
# already installed? force an overwrite to get the latest version
lobe install-skill claude-code --force
```
Then invoke:
- **Claude Code**: `/lobe-diagnose` or just ask about a slow API — Claude will pick up the skill automatically
- **Cursor**: `@lobe-diagnose` in chat
Both surfaces apply the same USE-method flow and napkin-math baselines that `lobe explain` uses under the hood.
## Questions
Common ones — does it work with HTTPS, do you have to trust a certificate, what does `lobe explain` send, is it free — are answered in the [FAQ](https://getlobe.dev/faq). Anything else: [getlobedev@gmail.com](mailto:getlobedev@gmail.com).