## Unreleased

* Fixed the scope legend not being displayed: after the egui_plot 0.38
  upgrade the `PlotMemory` id derived with `Id::unique(...)` no longer
  matched the id `Plot::show` uses internally, so `PlotMemory::load`
  returned `None` and the legend overlay was never rendered. The memory id
  is now computed once and pinned explicitly via `Plot::id(...)`, which
  also restores legend click-to-hide, alt-click isolate, right-click
  isolate, and the FFT panel's hidden-trace readback.

* Scope title bars are now also shown for scopes inside `Linear`/`Grid`
  layouts (e.g. vertically stacked scopes): every pane is wrapped in a
  `Tabs` container via `all_panes_must_have_tabs`, so each scope keeps its
  name and the shared Controls toggle visible.

* Added a **Formula** operation to the Math panel: free-text expressions over
  traces (`{name}` syntax, so names with spaces work), the time variable `t`,
  and constants `pi`/`e`. Supports `+ - * / ^`, parentheses, implicit
  multiplication, and the functions `sqrt`, `root(x,n)`, `exp`, `sin`, `cos`,
  `tan`, `asin`, `acos`, `atan`, `atan2(y,x)`, `sinh`, `cosh`, `tanh`, `asinh`,
  `acosh`, `atanh`, `abs`, `ln`, `log10`, `log2`, `log(x)` (base-10) and
  `log(x,b)` (arbitrary base). The editor provides colored insert-chips for
  every trace plus `t`/`pi`/`e` and a function menu, all inserting at the text
  cursor, and renders a live LaTeX-style preview where parenthesized divisions
  appear as stacked fractions with a horizontal line. Formula math traces are
  stateless, evaluate on the union of the referenced traces' timestamps
  (linear interpolation), and skip non-finite results as gaps. Pure `f(t)`
  formulas like `sin(2*pi*t)` work without any input trace. `t` evaluates in
  seconds, either as the absolute timestamp or relative to a per-trace
  resettable origin (the math row's ↻ button re-anchors `t` to the newest
  sample). Formulas additionally support `min(a,b,…)`/`max(a,b,…)` —
  per-sample extremes over any number of constants/traces — and
  `minh(a,b,…)`/`maxh(a,b,…)` — running extremes over the trace history
  (stateful like the Min/Max operation; the ↻ button clears them).
* `MathTrace::input_trace_names` now returns owned `Vec<TraceRef>` instead of
  `Vec<&TraceRef>` (needed to report formula-referenced traces).
* Added Markers to the Measurement panel: multiple named, colored single-point
  markers with optional horizontal/vertical lines and selectable dot shape,
  catch-trace snapping, per-marker visibility, drawn on all scopes, plus a
  Clear All action, `MARKER_*` events, and a `take_marker_change()` /
  `set_markers()` API for external synchronization across panes/tabs.

## v0.3.0

* Added threshold events
* Support Y axis with units
* Reworked traces menu
* Custom colors support
* Added possibility to control & readout position & size of plot window
* Rework API with unified config as opposed to multiple `run_...` functions
* Various UI improvements
* See git log for details
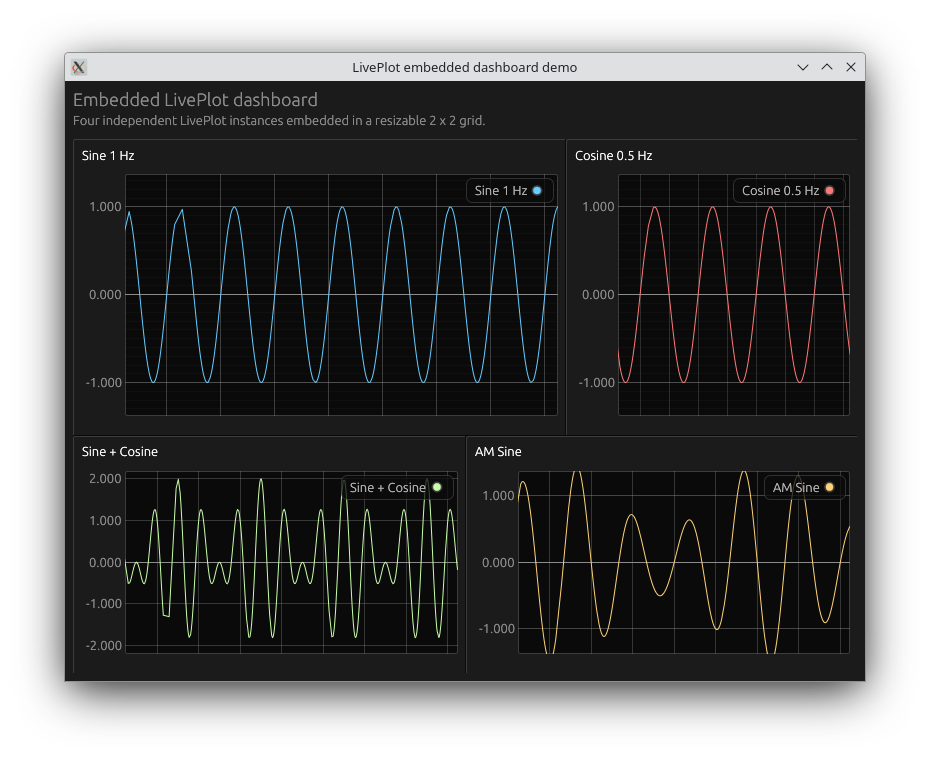
* Support embedded windows

## v0.2.0

* Added Math functionality
* See git log for details