## v0.3.0
* Added threshold events
* Support Y axis with units
* Reworked traces menu
* Custom colors support
* Added possibility to control & readout position & size of plot window
* Rework API with unified config as opposed to multiple `run_...` functions
* Various UI improvements
* See git log for details
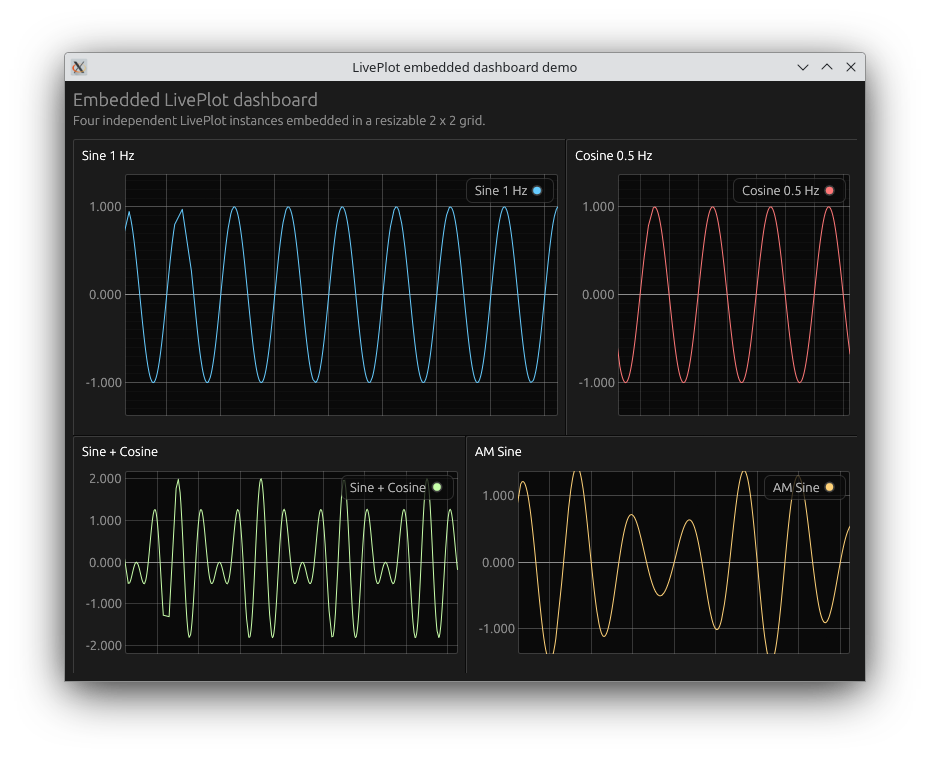
* Support embedded windows
## v0.2.0
* Added Math functionality
* See git log for details