
init-tracing-opentelemetry


A set of helpers to initialize (and more) tracing + opentelemetry (compose your own or use opinionated preset)
async
async
The init_subscriber() function returns an OtelGuard instance. Following the guard pattern, this struct provides no functions but, when dropped, ensures that any pending traces/metrics are sent before it exits. The syntax let _guard is suggested to ensure that Rust does not drop the struct until the application exits.
Re-exported crates
To avoid version mismatches (which break the OpenTelemetry global state), this crate re-exports its pinned versions of the core OpenTelemetry crates. You do not need to add them as direct dependencies in your Cargo.toml.
Instead of:
[]
= { = "...", = ["otlp"] }
= "0.32"
= "0.32"
= "0.33"
Use only:
[]
= { = "...", = ["otlp"] }
And reference the re-exported crates via init_tracing_opentelemetry:::
use opentelemetry;
use opentelemetry_sdk;
use tracing_opentelemetry;
Re-exported crates:
| Re-export | Original crate |
|---|---|
init_tracing_opentelemetry::opentelemetry |
opentelemetry |
init_tracing_opentelemetry::opentelemetry_sdk |
opentelemetry_sdk |
init_tracing_opentelemetry::tracing_opentelemetry |
tracing-opentelemetry |
Configuration Options
Presets
TracingConfig::development()- Pretty format, stderr, with debug infoTracingConfig::production()- JSON format, stdout, minimal metadataTracingConfig::debug()- Full verbosity with all span eventsTracingConfig::minimal()- Compact format, no OpenTelemetryTracingConfig::testing()- Minimal output for tests
Custom Configuration
use TracingConfig;
default
.with_pretty_format // or .with_json_format(), .with_compact_format()
.with_stderr // or .with_stdout(), .with_file(path)
.with_log_directives // Custom log levels
.with_line_numbers // Include line numbers
.with_thread_names // Include thread names
.with_otel // Enable OpenTelemetry
.init_subscriber
.expect;
Add custom layer, modify subscriber
Use init_subscriber_ext(|subscriber| {...} ) to transform the subscriber (registry), before application of the configuration.
use TracingConfig;
use TokioBlockedLayer;
use info;
use SubscriberExt;
async
Legacy API (deprecated)
For backward compatibility, the old API is still available:
pub fn build_loglevel_filter_layer() -> tracing_subscriber::filter::EnvFilter {
    // filter what is output on log (fmt)
    // std::env::set_var("RUST_LOG", "warn,axum_tracing_opentelemetry=info,otel=debug");
    std::env::set_var(
        "RUST_LOG",
        format!(
            // `otel::tracing` should be a level trace to emit opentelemetry trace & span
            // `otel::setup` set to debug to log detected resources, configuration read and infered
            "{},otel::tracing=trace,otel=debug",
            std::env::var("RUST_LOG")
                .or_else(|_| std::env::var("OTEL_LOG_LEVEL"))
                .unwrap_or_else(|_| "info".to_string())
        ),
    );
    EnvFilter::from_default_env()
}

pub fn build_otel_layer<S>() -> Result<OpenTelemetryLayer<S, Tracer>, BoxError>
where
    S: Subscriber + for<'a> LookupSpan<'a>,
{
    use crate::{
        init_propagator, //stdio,
        otlp,
        resource::DetectResource,
    };
    let otel_rsrc = DetectResource::default()
        //.with_fallback_service_name(env!("CARGO_PKG_NAME"))
        //.with_fallback_service_version(env!("CARGO_PKG_VERSION"))
        .build();
    let otel_tracer = otlp::init_tracer(otel_rsrc, otlp::identity)?;
    // to not send trace somewhere, but continue to create and propagate,...
    // then send them to `axum_tracing_opentelemetry::stdio::WriteNoWhere::default()`
    // or to `std::io::stdout()` to print
    //
    // let otel_tracer =
    //     stdio::init_tracer(otel_rsrc, stdio::identity, stdio::WriteNoWhere::default())?;
    init_propagator()?;
    Ok(tracing_opentelemetry::layer().with_tracer(otel_tracer))
}
To retrieve the current trace_id (eg to add it into error message (as header or attributes))
# use tracing_opentelemetry_instrumentation_sdk;
let trace_id = find_current_trace_id;
//json!({ "error" : "xxxxxx", "trace_id": trace_id})
Configuration based on the environment variables
To ease setup and compliance with OpenTelemetry SDK configuration, the configuration can be done with the following environment variables (see sample init_tracing() above):
OTEL_EXPORTER_OTLP_TRACES_ENDPOINTfallback toOTEL_EXPORTER_OTLP_ENDPOINTfor the url of the exporter / collectorOTEL_EXPORTER_OTLP_TRACES_PROTOCOLfallback toOTEL_EXPORTER_OTLP_PROTOCOL, fallback to auto-detection based on ENDPOINT portOTEL_SERVICE_NAMEfor the name of the serviceOTEL_PROPAGATORSfor the configuration of the propagatorsOTEL_TRACES_SAMPLER&OTEL_TRACES_SAMPLER_ARGfor configuration of the sampler
Few other environment variables can also be used to configure OTLP exporter (eg to configure headers, authentication,, etc...):
# For GRPC:
# For HTTP:
In the context of kubernetes, some of the above environment variables can be injected by the Opentelemetry operator (via inject-sdk):
apiVersion: apps/v1
kind: Deployment
spec:
  template:
    metadata:
      annotations:
        # to inject environment variables only by opentelemetry-operator
        instrumentation.opentelemetry.io/inject-sdk: "opentelemetry-operator/instrumentation"
        instrumentation.opentelemetry.io/container-names: "app"
      containers:
        - name: app
Or if you don't setup inject-sdk, you can manually set the environment variable eg
apiVersion: apps/v1
kind: Deployment
spec:
  template:
    metadata:
      containers:
        - name: app
          env:
            - name: OTEL_SERVICE_NAME
              value: "app"
            - name: OTEL_EXPORTER_OTLP_PROTOCOL
              value: "grpc"
            # for otel collector in `deployment` mode, use the name of the service
            # - name: OTEL_EXPORTER_OTLP_ENDPOINT
            #   value: "http://opentelemetry-collector.opentelemetry-collector:4317"
            # for otel collector in sidecar mode (imply to deploy a sidecar CR per namespace)
            - name: OTEL_EXPORTER_OTLP_ENDPOINT
              value: "http://localhost:4317"
            # for `daemonset` mode: need to use the local daemonset (value interpolated by k8s: `$(...)`)
            # - name: OTEL_EXPORTER_OTLP_ENDPOINT
            #   value: "http://$(HOST_IP):4317"
            # - name: HOST_IP
            #   valueFrom:
            #     fieldRef:
            #       fieldPath: status.hostIP
Troubleshot why no trace?
-
check you only have a single version of opentelemetry (could be part of your CI/build), use
cargo-denyorcargo tree# Check only one version of opentelemetry should be used # else issue with setup of global (static variable)The recommended fix is to drop direct dependencies on
opentelemetry,opentelemetry_sdk, andtracing-opentelemetryand use the re-exports provided by this crate instead. This guarantees version alignment. -
check the code of your exporter and the integration with
tracing(as subscriber's layer) -
check the environment variables of opentelemetry
OTEL_EXPORTER...andOTEL_TRACES_SAMPLER(values are logged on targetotel::setup) -
check that log target
otel::tracingenable log leveltrace(orinfoif you usetracing_level_infofeature) to generate span to send to opentelemetry collector.
Metrics
To configure opentelemetry metrics, enable the metrics feature, this will initialize a SdkMeterProvider, set it globally and add a a MetricsLayer to allow using tracing events to produce metrics.
The opentelemetry_sdk can still be used to produce metrics as well, since we configured the SdkMeterProvider globally, so any Axum/Tonic middleware that does not use tracing but directly opentelemetry::metrics will work.
Configure the following set of environment variables to configure the metrics exporter (on top of those configured above):
OTEL_EXPORTER_OTLP_METRICS_ENDPOINToverride toOTEL_EXPORTER_OTLP_ENDPOINTfor the url of the exporter / collectorOTEL_EXPORTER_OTLP_METRICS_PROTOCOLoverride toOTEL_EXPORTER_OTLP_PROTOCOL, fallback to auto-detection based on ENDPOINT portOTEL_EXPORTER_OTLP_METRICS_TIMEOUTto set the timeout for the connection to the exporterOTEL_EXPORTER_OTLP_METRICS_TEMPORALITY_PREFERENCEto set the temporality preference for the exporterOTEL_METRIC_EXPORT_INTERVALto set frequence of metrics export in milliseconds, defaults to 60s
Logs
To configure OpenTelemetry log export, enable the logs feature. This initializes a SdkLoggerProvider and adds a log bridge layer so that tracing events are forwarded to the OpenTelemetry log pipeline and exported via OTLP.
[]
= { = "*", = ["otlp", "logs"] }
Standard tracing macros emit logs that are automatically bridged:
async
Log export can be toggled at runtime via .with_logs(bool):
use TracingConfig;
//...
default
.with_logs // disable log export (default: enabled when feature is active)
.init_subscriber
.expect;
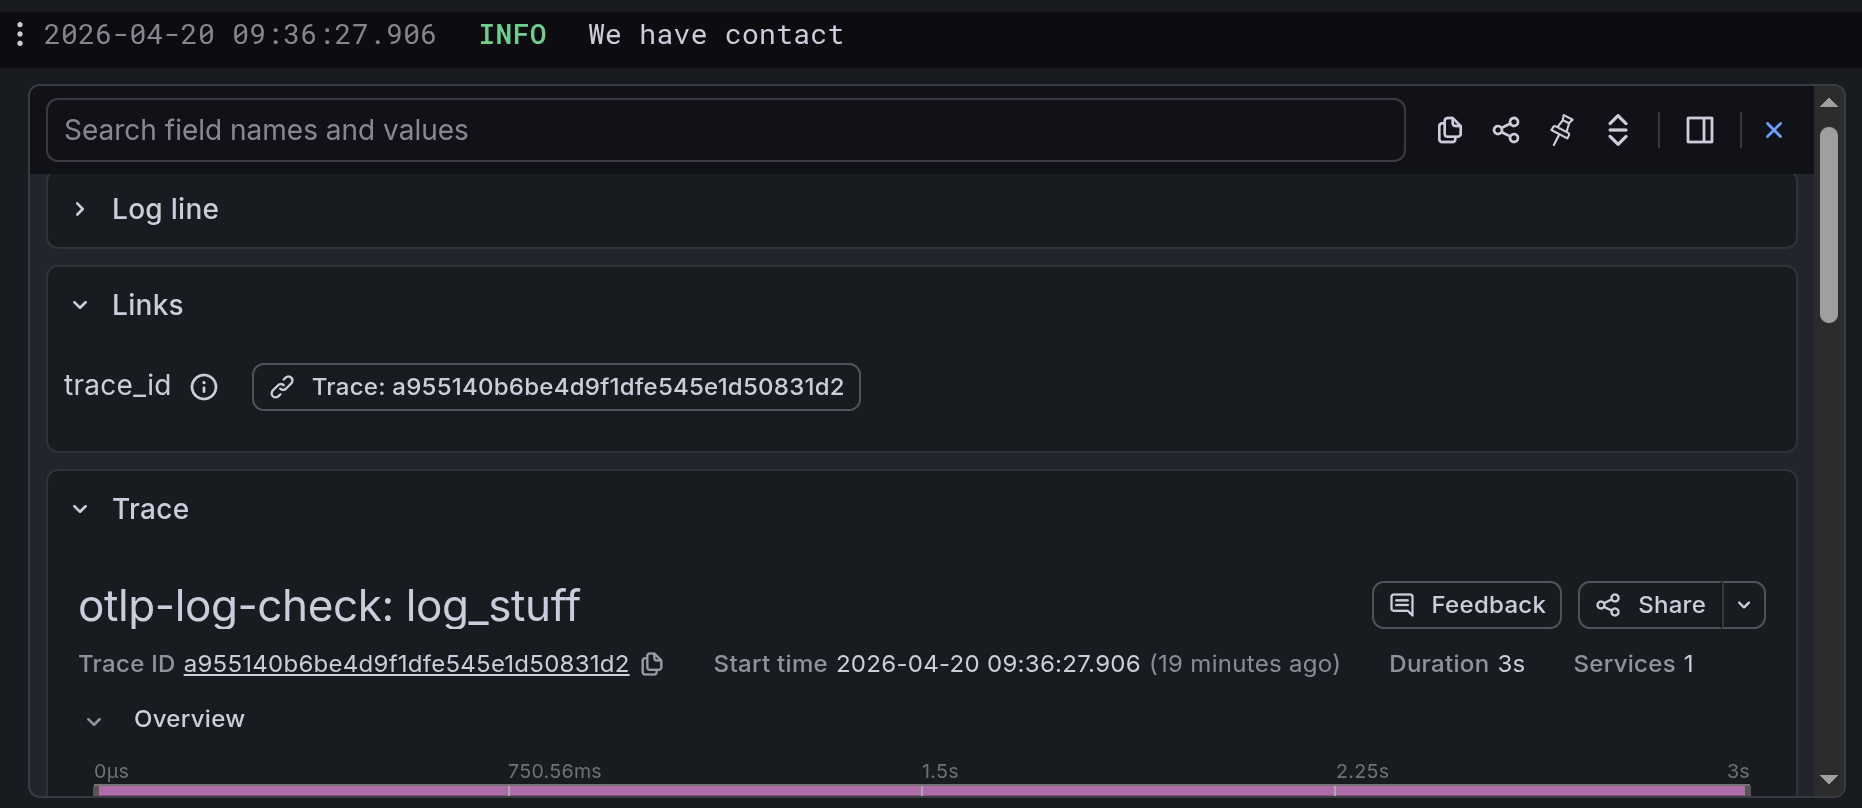
Traces are automatically attached to logs as well, so if the logs are queried in Grafana (for example), the trace automatically links to the log line.
Configure the following environment variables to control the logs exporter (in addition to the shared variables above):
OTEL_EXPORTER_OTLP_LOGS_ENDPOINToverridesOTEL_EXPORTER_OTLP_ENDPOINTfor the log pipeline; for HTTP the path/v1/logsis appended automaticallyOTEL_EXPORTER_OTLP_LOGS_PROTOCOLoverridesOTEL_EXPORTER_OTLP_PROTOCOL, falls back to port-based auto-detection
# For GRPC:
# For HTTP:
Note: A protocol must be set (via env var or inferable from the endpoint port). If neither is found, no log exporter is created and a warning is emitted on target
otel::setup.