# Renders the docs/performance.md charts from xgboost.dat and
# optimization.dat.
#
#     gnuplot -c docs/benchmarks/charts.gp
#
# Run from the repository root. The .dat values mirror the tables in
# docs/performance.md. After refreshing the tables and .dat
# files, regenerate the SVGs with the command above. Requires gnuplot 5.4
# or newer.
#
# Cluster offsets: with `clustered gap 1`, a cluster of N bars spans
# N/(N+1) x units, so bar k of N sits at (2k - N + 1) / (2(N+1)).

set datafile commentschars "#"
xgb_data = "docs/benchmarks/xgboost.dat"
opt_data = "docs/benchmarks/optimization.dat"

# hessboost is green and XGBoost blue; darker shades are lower
# thread counts throughout.
seq_t1 = "#1b5e20"
seq_t4 = "#43a047"
seq_t16 = "#a5d6a7"
xgb_t1 = "#1565c0"
xgb_t4 = "#1e88e5"
xgb_t16 = "#90caf9"

# percent of scalar-baseline time removed by the optimized build
less(base, opt) = 100.0 * (base - opt) / base

set style fill solid 1.0 border lt -1
set style histogram clustered gap 1
set style data histograms
set boxwidth 0.9
set grid ytics lc rgb "#d0d0d0" lw 1
set border 3
set tics nomirror out
set xtics scale 0
set bmargin 5

# SVG output is resolution independent; the size only sets the aspect
# ratio and the font-to-plot proportions.
set terminal svg size 960,520 dynamic font "sans-serif,13" background rgb "white"

# --- Speedup over XGBoost by thread count --------------------------------------

set output "docs/benchmarks/xgboost-speedup.svg"

set title "hessboost speedup over XGBoost 3.4.1 (higher is better)\n{/*0.8 median of six fits, Apple M3 Max, CPU hist, 100 rounds}"
set ylabel "fit time ratio, XGBoost / hessboost"
set yrange [0:3.2]
set ytics 0.5
set arrow 1 from -0.5,1 to 3.5,1 nohead lc rgb "#303030" dt 2 lw 1.5 front
set key top right reverse Left samplen 2 spacing 1.3
plot xgb_data using ($3/$2):xtic(1) lc rgb seq_t1  title "1 thread", \
     xgb_data using ($5/$4)          lc rgb seq_t4  title "4 threads", \
     xgb_data using ($7/$6)          lc rgb seq_t16 title "16 threads", \
     xgb_data using ($0-0.25):($3/$2):(sprintf("%.2fx", $3/$2)) \
          with labels offset 0,0.6 font ",9" notitle, \
     xgb_data using ($0+0.00):($5/$4):(sprintf("%.2fx", $5/$4)) \
          with labels offset 0,0.6 font ",9" notitle, \
     xgb_data using ($0+0.25):($7/$6):(sprintf("%.2fx", $7/$6)) \
          with labels offset 0,0.6 font ",9" notitle, \
     keyentry with lines lc rgb "#303030" dt 2 lw 1.5 title "XGBoost = 1.0x"

unset arrow 1

# --- Median fit time by workload and thread count ------------------------------

set output "docs/benchmarks/xgboost-threads.svg"

set title "Median fit time, hessboost vs XGBoost 3.4.1 (lower is better)\n{/*0.8 seconds, log scale, fresh matrix construction plus training}"
set ylabel "fit time (s)"
set logscale y 10
set yrange [0.15:5]
set ytics ("0.2" 0.2, "0.5" 0.5, "1" 1, "2" 2, "5" 5)
set mytics 10
set key top left reverse Left samplen 1.5 spacing 1.1

plot xgb_data using 2:xtic(1) lc rgb seq_t1  title "hessboost, 1 thread", \
     xgb_data using 3:xtic(1) lc rgb xgb_t1  title "XGBoost, 1 thread", \
     xgb_data using 4:xtic(1) lc rgb seq_t4  title "hessboost, 4 threads", \
     xgb_data using 5:xtic(1) lc rgb xgb_t4  title "XGBoost, 4 threads", \
     xgb_data using 6:xtic(1) lc rgb seq_t16 title "hessboost, 16 threads", \
     xgb_data using 7:xtic(1) lc rgb xgb_t16 title "XGBoost, 16 threads"

unset logscale

# --- Scalar-baseline comparisons ------------------------------------------------

set ylabel "time cut vs scalar baseline, %"
set yrange [0:100]
set ytics 25

# --- Pointwise kernels ---------------------------------------------------------

# Three 960px charts, one per kernel kind, so the cluster labels stay
# readable when the SVG is scaled down to the page width (renderers scale
# to the container and never upscale). Cluster titles under the x axis
# mark the dense rows and the softmax rows (blocks 2 and 3) or the
# multiclass rows (block 4) of optimization.dat.
set bmargin 6
unset key
array kname[3]  = ["gradient", "transform", "metric"]
array ktitle[3] = ["Objective gradient", "Prediction transform", "Metric"]
array g1text[3] = ["dense", "dense", "dense"]
array g1x[3]    = [2.0, 0.5, 3.0]
array g2text[3] = ["softmax, by class count", "softmax, by class count", "multiclass, 32 classes"]
array g2x[3]    = [7.5, 4.5, 7.5]

do for [k=1:3] {
    set output sprintf("docs/benchmarks/%s-optimization.svg", kname[k])
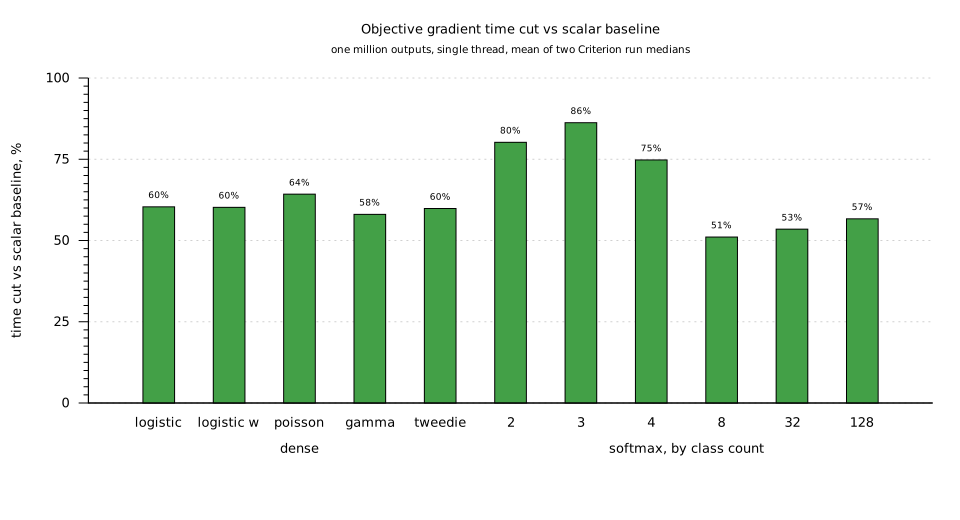
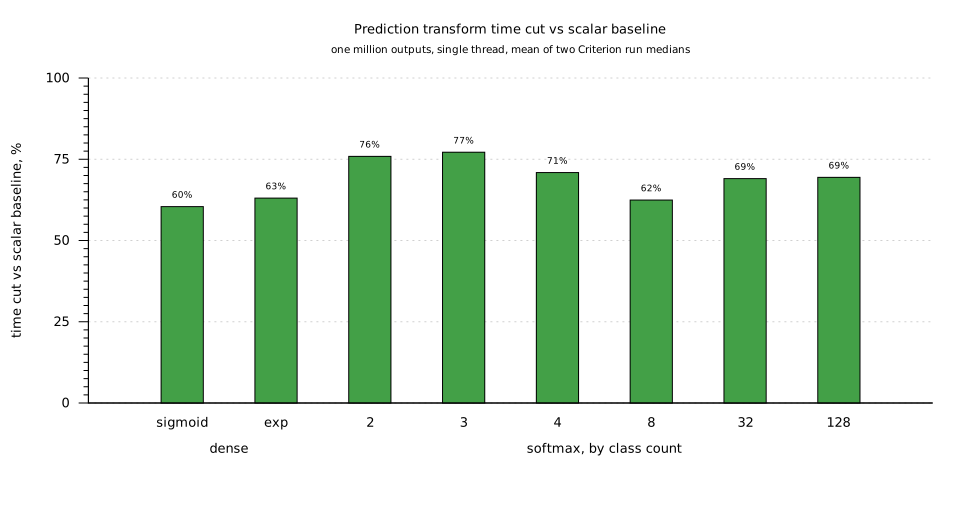
    set title sprintf("%s time cut vs scalar baseline\n{/*0.8 one million outputs, single thread, mean of two Criterion run medians}", ktitle[k])
    set label 1 g1text[k] at g1x[k], graph -0.14 center front
    set label 2 g2text[k] at g2x[k], graph -0.14 center front
    plot opt_data index k+1 using (less($2,$3)):xtic(1) lc rgb seq_t4, \
         ''         index k+1 using ($0):(less($2,$3)):(sprintf("%.0f%%", less($2,$3))) \
              with labels offset 0,0.6 font ",9" notitle
}

unset label 1
unset label 2
set bmargin 5

# --- Full training and single-tree builds --------------------------------------

# Both charts place the key outside the plot: their tallest bars reach
# 85-92%, leaving no clear corner inside.
set key outside right top reverse Left samplen 2 spacing 1.3

set output "docs/benchmarks/training-optimization.svg"
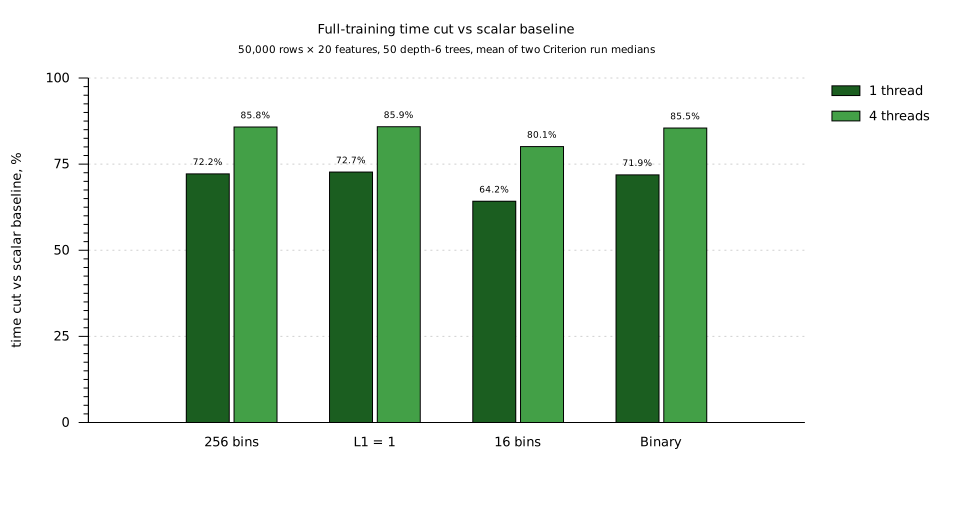
set title "Full-training time cut vs scalar baseline\n{/*0.8 50,000 rows × 20 features, 50 depth-6 trees, mean of two Criterion run medians}"

plot opt_data index 0 using (less($2,$3)):xtic(1) lc rgb seq_t1 title "1 thread", \
     ''         index 0 using (less($4,$5))          lc rgb seq_t4 title "4 threads", \
     ''         index 0 using ($0-1.0/6):(less($2,$3)):(sprintf("%.1f%%", less($2,$3))) \
          with labels offset 0,0.6 font ",9" notitle, \
     ''         index 0 using ($0+1.0/6):(less($4,$5)):(sprintf("%.1f%%", less($4,$5))) \
          with labels offset 0,0.6 font ",9" notitle

set output "docs/benchmarks/tree-optimization.svg"
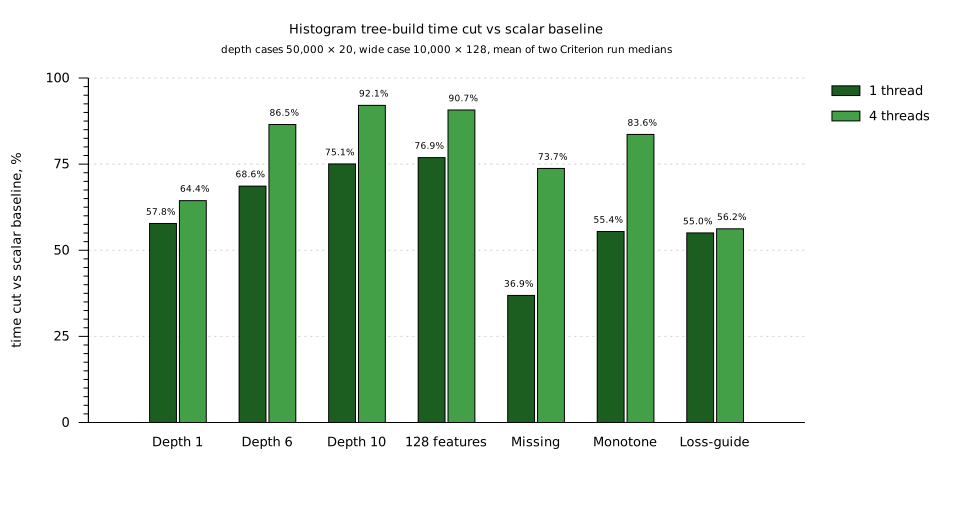
set title "Histogram tree-build time cut vs scalar baseline\n{/*0.8 depth cases 50,000 × 20, wide case 10,000 × 128, mean of two Criterion run medians}"

plot opt_data index 1 using (less($2,$3)):xtic(1) lc rgb seq_t1 title "1 thread", \
     ''         index 1 using (less($4,$5))          lc rgb seq_t4 title "4 threads", \
     ''         index 1 using ($0-0.19):(less($2,$3)):(sprintf("%.1f%%", less($2,$3))) \
          with labels offset 0,0.6 font ",9" notitle, \
     ''         index 1 using ($0+0.19):(less($4,$5)):(sprintf("%.1f%%", less($4,$5))) \
          with labels offset 0,0.6 font ",9" notitle