# graplot
[](https://crates.io/crates/graplot)
[](https://docs.rs/graplot/0.1.5/graplot/)
'graplot' is an experimental plotting library written in Rust that is based on [macroquad].
It creates a window displaying the graphs.
[macroquad]: https://github.com/elftausend/macroquad
## [Examples]
[Examples]: https://github.com/elftausend/graplot/tree/main/examples
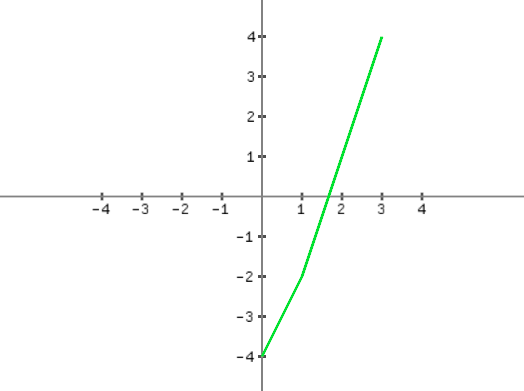
```rust
use graplot::Plot;
let plot = Plot::new([-4., -2., 1., 4.]);
plot.show();
```
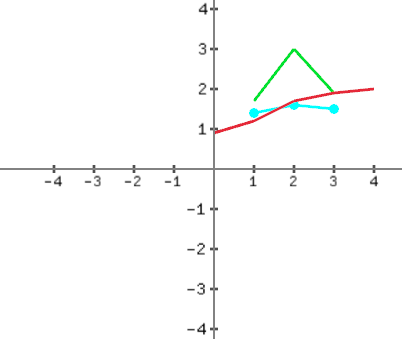
Multiple graphs:
```rust
use graplot::Plot;
let xs = [1., 2., 3.,];
let ys = [1.7, 3., 1.9];
let ys1 = [1.4, 1.6, 1.5];
let ys2 = [0.9, 1.2, 1.7, 1.9, 2.];
let mut plot = Plot::new((xs, ys));
plot.add((xs, ys1, "c-o"));
plot.add((ys2, "r-"));
plot.show();
```
Label the x and y axis and set a title:
```rust
use graplot::{x, Plot};
plot.set_title("cosine wave");
//currently, no x axis label
plot.set_xlabel("x axis");
plot.set_ylabel("y axis");
plot.show();
```
<img src="pictures/cosine_labeled.png" alt="cosine labeled" width="400"/>
Sine wave:
```rust
use graplot::Plot;
let mut xs = [0.; 1000];
let mut add = 0f64;
for idx in 0..1000 {
xs[idx] = add/1000.;
add += 1.;
}
let mut ys = [0.; 1000];
for (i, y) in ys.iter_mut().enumerate() {
*y = (2. * std::f64::consts::PI * xs[i]).sin();
}
plot.show();
```

x³ + x² - 0.08:
```rust
use graplot::{Plot, x};
// x(...) ... sets the absolute max value for x
```
<img src="pictures/pol3.png" alt="pol3" width="400"/>
x² - 0.5:
```rust
use graplot::Plot;
```

Using a line description: (matplotlib)
```rust
use graplot::Plot;
// c ... cyan color, - ... solid line, o ... ring marker
let plot = Plot::new(([-4., -3., -3.4, -3.75, -4.1], "c-o"));
plot.show();
```

Spawning multiple windows on linux:
```rust
let h = plot.show_threaded() // show_threaded() is currently linux only;
plot.show();
h.join().unwrap() // you need to close both windows
```
<img src="pictures/multiple_windows.png" alt="multiple windows" width="500"/>
## Changelog
- 0.1.5: Label x and y axis, set title, mutliple windows on linux
- 0.1.4: Multiple graphs