# :mage_woman: GraphWiz
[![build status][BuildShield]][BuildLink] [![crates.io version][CratesShield]][CratesLink]
GraphWiz provides builders to generate and render graphs in the [GraphViz DOT
format](https://graphviz.org/). It is adapted from [its Haskell
equivalent](https://github.com/nicuveo/graphwiz).
It's a "wizard" for Graphviz's DOT format, hence the name "GraphWiz".
[BuildLink]: https://github.com/nicuveo/graphwiz-rs/actions/workflows/rust.yml?query=branch%3Amain
[BuildShield]: https://img.shields.io/github/actions/workflow/status/nicuveo/graphwiz-rs/rust.yml?event=push&style=flat&branch=main&label=build
[CratesLink]: https://crates.io/crates/graphwiz
[CratesShield]: https://img.shields.io/crates/v/graphwiz
### Overview
This library is centered around a simple trait: `Builder`. Each `Builder` is
tied to a given "scope" of the graph: a `RootBuilder` is the scope of the
top-level graph definition, while a `SubgraphBuilder` represents the scope of
its associated subgraph or cluster. A builder provide functions to add new
entities within its scope: nodes, edges, subgraphs, and clusters.
Each entity is given a unique internal identifier, which avoid naming issues
within the graph. Furthermore, edges are "smart" and do "auto-compound": if an
edge starts from or goes to a cluster, the graph is labelled as "compound", and
the [attributes of the edge](https://graphviz.org/docs/attrs/lhead/) are
adjusted so that they point properly to the cluster.
### Example
The test file `example.rs` contains the following:
```rust
let mut root = Graph::new_builder();
root.defaults_mut(Kind::Node).extend(HashMap::from([
(attrs::FILLCOLOR, "lavender".to_string()),
(attrs::STYLE, "filled".to_string()),
]));
let a = root.new_node("a");
let b = root.new_node("b");
let ab = root.new_edge(a, b);
root.attributes_mut(ab)
.insert(attrs::STYLE, "dotted".to_string());
let mut cluster = root.new_cluster("box");
let c = cluster.new_node_with(
"c",
HashMap::from([
(attrs::SHAPE, "circle".to_string()),
(attrs::FILLCOLOR, "cornflowerblue".to_string()),
]),
);
cluster.build();
root.new_edge(c, a);
root.new_edge(c, b);
let graph = root.build();
let text = render_digraph(&graph);
```
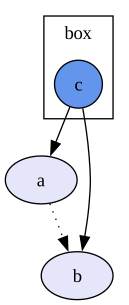
This generates the following DOT graph.
```DOT
digraph {
node_1 [fillcolor="lavender", label="a", style="filled"]
node_2 [fillcolor="lavender", label="b", style="filled"]
node_1 -> node_2 [style="dotted"]
node_5 -> node_1
node_5 -> node_2
subgraph cluster_4 {
label="box"
node_5 [fillcolor="cornflowerblue", label="c", shape="circle", style="filled"]
}
}
```
Which DOT renders like this: