1
2
3
4
5
6
7
8
9
10
11
12
13
14
15
16
17
18
19
20
21
22
23
24
25
26
27
28
29
30
31
32
33
34
35
36
37
38
39
40
41
42
43
44
45
46
47
48
49
50
51
52
53
54
55
56
57
58
59
60
61
//! # Ferrischart: *<small>Build informative graphs in Rust</small>*
//!
//! Ferrischart is a tool to build informative graphs in Rust. ferrischart is built entirely from the ground up completely
//! in Rust! It aims to interface will Rust data types as well as the [polars](https://crates.io/crates/polars) crate.
//!
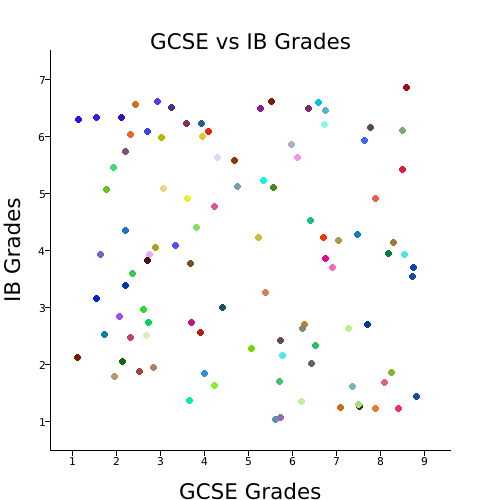
//! ## Quickstart: Quickly building a Scatter Graph
//! To showcase how easy it is to use ferrischart, we'll build a scatter graph, comparing what grades students achieved
//! in an exam conducted when they're 15/16 (GCSE) and an exam, conducted when they're 17/18 (IB).
//! ```rust
//! use ferrischart::{error::ChartResult, charts::scatter::ScatterGraph};
//!
//! # fn example() -> ChartResult<()> {
//! // first we'll generate some random data for this example
//! let mut data = vec![];
//! let mut rng = rand::thread_rng();
//! for _ in 0..100 {
//! let x = rng.gen_range(1.0..9.0);
//! let y = rng.gen_range(1.0..7.0);
//! data.push((x, y));
//! }
//!
//! // now we'll actually build the graph
//! ScatterGraph::build()
//! .set_title("GCSE vs IB Grades") // set a title for your graph
//! .set_axis_text("GCSE Grades", "IB Grades") // set some text describing each axis
//! .load_data(data) // load data
//! .draw("cool-graph.png")?; // draw and save your graph
//! # Ok(())
//! # }
//! ```
//!
//! The following code should generate a graph that looks something like this (keep in mind, your data positions may differ)
//!