<img src=".github/banner.png" alt="ferrischart">
## What is Ferrischart?
Ferrischart is a project I'm working on to build good-looking charts in Rust. This crate is inspired by matplotlib, but doesn't necessarily aim to replace its capabilities.
Ferrischart is a heavy WIP. Feel free to contribute if you have time.
### An example of what ferrischart is currently capable of:
#### Scatter Graphs
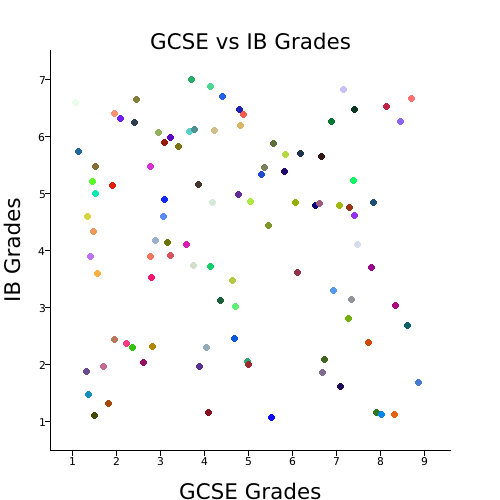
Running `cargo test` reported that it took `0.38s` to generate. The test can be seen in `src/lib.rs`, which used `100` pairs of `(f32, f32)` data. Keep in mind this is the time it took to run the test + any additional procedures cargo needs to run. This was run on the following machine:
```diff
Model Name: MacBook Pro
+ Model Identifier: MacBookPro11,3
+ Processor Name: Quad-Core Intel Core i7
+ Processor Speed: 2.8 GHz
Number of Processors: 1
Total Number of Cores: 4
L2 Cache (per Core): 256 KB
L3 Cache: 6 MB
Hyper-Threading Technology: Enabled
+ Memory: 16 GB
System Firmware Version: 474.0.0.0.0
```