1
2
3
4
5
6
7
8
9
10
11
12
13
14
15
16
17
18
19
20
21
22
23
24
25
26
27
28
29
30
31
32
33
34
35
36
37
38
39
40
41
42
43
44
45
46
47
48
49
50
51
52
53
54
55
56
57
58
59
60
61
62
63
64
65
66
67
68
69
70
71
72
73
74
75
76
77
78
79
80
81
82
83
84
85
86
87
88
89
90
91
92
93
94
95
96
97
98
99
100
101
102
103
104
105
106
107
108
109
110
111
112
113
114
115
116
117
118
119
120
121
122
123
124
125
126
127
128
129
130
131
132
133
134
135
136
137
138
139
140
141
142
143
144
145
146
147
148
149
150
151
152
153
154
155
156
157
158
159
160
161
162
163
164
165
166
167
168
169
170
171
172
173
174
175
176
177
178
179
180
181
182
183
184
185
186
187
188
189
190
191
192
193
194
195
196
197
198
199
200
201
202
203
204
205
206
207
208
209
210
211
212
213
214
215
216
217
218
219
220
221
222
223
224
225
226
227
228
229
230
231
232
233
234
235
236
237
238
239
240
241
//! [](./LICENSE.txt)
//! [](https://crates.io/crates/egui-plotter)
//! [](https://docs.rs/egui-plotter)
//! [](https://openapeshop.org/)
//! ## *simple to use utilties for integrating plotter into egui*
//!
//! [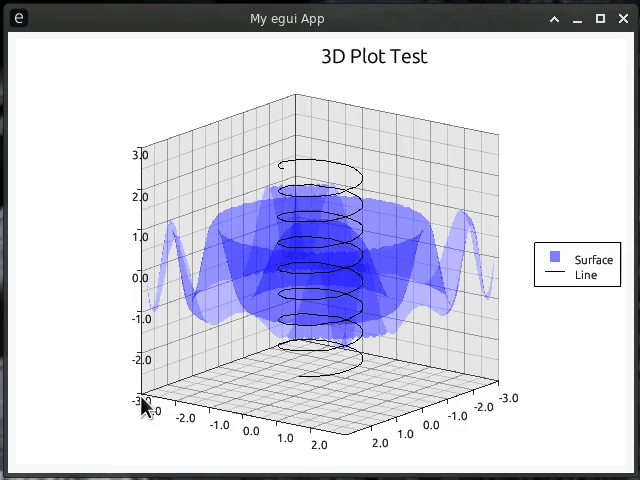](https://github.com/Gip-Gip/egui-plotter/blob/main/examples/3d.rs)
//! [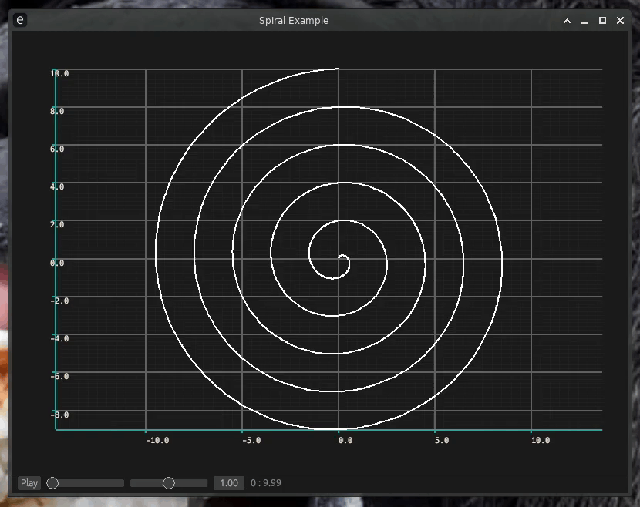](https://github.com/Gip-Gip/egui-plotter/blob/main/examples/spiral.rs)
//!
//! ## Usage
//!
//! This crate can be used by adding `egui-plotter` to the dependencies in your
//! project's `Cargo.toml`.
//!
//! ```toml
//! [dependencies]
//! egui-plotter = "0.3.0"
//! ```
//!
//! **It is also heavily recommended you disable feathering in your egui context,
//! as not only does it slow things down but it causes artifacts with certain plots.**
//!
//! See line 24 example below to see how to disable feathering.
//!
//! ### Features
//!
//! * `timechart` - Includes all the pre-made animatable charts like XyTimeData and TimeData.
//!
//! ## Examples
//!
//! Here's a simple plotter example being run on native eframe.
//! Derived from
//! [eframe](https://docs.rs/eframe/0.22.0/eframe/index.html#usage-native) and
//! [plotters](https://docs.rs/plotters/0.3.4/plotters/index.html#quick-start).
//!
//! ```rust
//! use eframe::egui::{self, CentralPanel, Visuals};
//! use egui_plotter::EguiBackend;
//! use plotters::prelude::*;
//!
//! fn main() {
//! let native_options = eframe::NativeOptions::default();
//! eframe::run_native(
//! "Simple Example",
//! native_options,
//! Box::new(|cc| Ok(Box::new(Simple::new(cc)))),
//! )
//! .unwrap();
//! }
//!
//! struct Simple;
//!
//! impl Simple {
//! fn new(cc: &eframe::CreationContext<'_>) -> Self {
//! // Disable feathering as it causes artifacts
//! let context = &cc.egui_ctx;
//!
//! context.tessellation_options_mut(|tess_options| {
//! tess_options.feathering = false;
//! });
//!
//! // Also enable light mode
//! context.set_visuals(Visuals::light());
//!
//! Self
//! }
//! }
//!
//! impl eframe::App for Simple {
//! fn update(&mut self, ctx: &egui::Context, _frame: &mut eframe::Frame) {
//! CentralPanel::default().show(ctx, |ui| {
//! let root = EguiBackend::new(ui).into_drawing_area();
//! root.fill(&WHITE).unwrap();
//! let mut chart = ChartBuilder::on(&root)
//! .caption("y=x^2", ("sans-serif", 50).into_font())
//! .margin(5)
//! .x_label_area_size(30)
//! .y_label_area_size(30)
//! .build_cartesian_2d(-1f32..1f32, -0.1f32..1f32)
//! .unwrap();
//!
//! chart.configure_mesh().draw().unwrap();
//!
//! chart
//! .draw_series(LineSeries::new(
//! (-50..=50).map(|x| x as f32 / 50.0).map(|x| (x, x * x)),
//! &RED,
//! ))
//! .unwrap()
//! .label("y = x^2")
//! .legend(|(x, y)| PathElement::new(vec![(x, y), (x + 20, y)], &RED));
//!
//! chart
//! .configure_series_labels()
//! .background_style(&WHITE.mix(0.8))
//! .border_style(&BLACK)
//! .draw()
//! .unwrap();
//!
//! root.present().unwrap();
//! });
//! }
//! }
//! ```
//!
//! ### Charts
//!
//! Alternatively, the above example can be made with a Chart type to allow easy
//! user interactivity with your plotter charts. You can either make your own chart or
//! use a prebuilt chart type included in the `charts` module.
//!
//! ```rust
//! use eframe::egui::{self, CentralPanel, Key, Visuals};
//! use egui_plotter::{Chart, MouseConfig};
//! use plotters::prelude::*;
//! use std::ops::Range;
//!
//! fn main() {
//! let native_options = eframe::NativeOptions::default();
//! eframe::run_native(
//! "ParaChart Example",
//! native_options,
//! Box::new(|cc| Ok(Box::new(ParaChart::new(cc)))),
//! )
//! .unwrap();
//! }
//!
//! struct ParaChart {
//! chart: Chart<(Range<f32>, Range<f32>)>,
//! }
//!
//! impl ParaChart {
//! fn new(cc: &eframe::CreationContext<'_>) -> Self {
//! // Disable feathering as it causes artifacts
//! let context = &cc.egui_ctx;
//!
//! context.tessellation_options_mut(|tess_options| {
//! tess_options.feathering = false;
//! });
//!
//! // Also enable light mode
//! context.set_visuals(Visuals::light());
//!
//! // We use data to adjust the range of the chart. This can be useful for
//! // line plots where the X represents time and we want to play through
//! // the X, but that is not what we are using it for here
//! let chart = Chart::new((-3f32..3f32, -0.5f32..3f32))
//! .mouse(MouseConfig::enabled())
//! .builder_cb(Box::new(|area, _t, ranges| {
//! // Build a chart like you would in any other plotter chart.
//! // The drawing area and ranges are provided by the callback,
//! // but otherwise everything else is the same.
//!
//! let (x_range, y_range) = ranges;
//!
//! let mut chart = ChartBuilder::on(area)
//! .caption("y=x^2", ("sans-serif", 50).into_font())
//! .margin(5)
//! .x_label_area_size(30)
//! .y_label_area_size(30)
//! .build_cartesian_2d(x_range.to_owned(), y_range.to_owned())
//! .unwrap();
//!
//! chart.configure_mesh().draw().unwrap();
//!
//! chart
//! .draw_series(LineSeries::new(
//! (-50 * (x_range.end as i32)..=(50 * x_range.end as i32))
//! .map(|x| x as f32 / 50.0)
//! .map(|x| (x, x * x)),
//! &RED,
//! ))
//! .unwrap()
//! .label("y = x^2")
//! .legend(|(x, y)| PathElement::new(vec![(x, y), (x + 20, y)], RED));
//!
//! chart
//! .configure_series_labels()
//! .background_style(WHITE.mix(0.8))
//! .border_style(BLACK)
//! .draw()
//! .unwrap();
//! }));
//!
//! Self { chart }
//! }
//! }
//!
//! impl eframe::App for ParaChart {
//! fn update(&mut self, ctx: &egui::Context, _frame: &mut eframe::Frame) {
//! CentralPanel::default().show(ctx, |ui| {
//! // Press 1 for the range -1..1, 2 for -2..2, 3 for -3..3
//! ui.input(|input| {
//! if input.key_down(Key::Num1) {
//! *self.chart
//! .get_data_mut() = (-1f32..1f32, -0.5f32..1f32);
//! }
//! if input.key_down(Key::Num2) {
//! *self.chart
//! .get_data_mut() = (-2f32..2f32, -0.5f32..2f32);
//! }
//!
//! if input.key_down(Key::Num3) {
//! *self.chart
//! .get_data_mut() = (-3f32..3f32, -0.5f32..3f32);
//! }
//! });
//!
//! self.chart.draw(ui);
//! });
//! }
//! }
//! ```
pub use ;
pub use ;
use Range;