<!DOCTYPE html>
<html>
<head>
<meta http-equiv="Content-Type" content="text/html; charset=utf-8">
<title>Fibonacci/Iterative - Criterion.rs</title>
<style type="text/css">
body {
font: 14px Helvetica Neue;
text-rendering: optimizelegibility;
}
.body {
width: 960px;
margin: auto;
}
th {
font-weight: 200
}
th,
td {
padding-right: 3px;
padding-bottom: 3px;
}
a:link {
color: #1F78B4;
text-decoration: none;
}
th.ci-bound {
opacity: 0.6
}
td.ci-bound {
opacity: 0.5
}
.stats {
width: 80%;
margin: auto;
display: flex;
}
.additional_stats {
flex: 0 0 60%
}
.additional_plots {
flex: 1
}
h2 {
font-size: 36px;
font-weight: 300;
}
h3 {
font-size: 24px;
font-weight: 300;
}
#footer {
height: 40px;
background: #888;
color: white;
font-size: larger;
font-weight: 300;
}
#footer a {
color: white;
text-decoration: underline;
}
#footer p {
text-align: center
}
</style>
</head>
<body>
<div class="body">
<h2>Fibonacci/Iterative</h2>
<div class="absolute">
<section class="plots">
<table width="100%">
<tbody>
<tr>
<td>
<a href="pdf.svg">
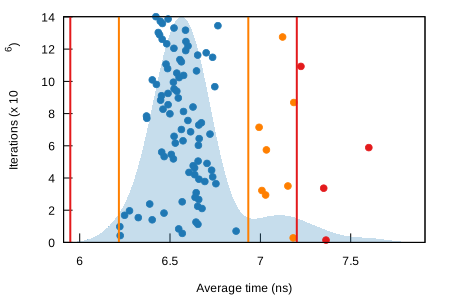
<img src="pdf_small.svg" alt="PDF of Slope" width="450" height="300" />
</a>
</td>
<td>
<a href="regression.svg">
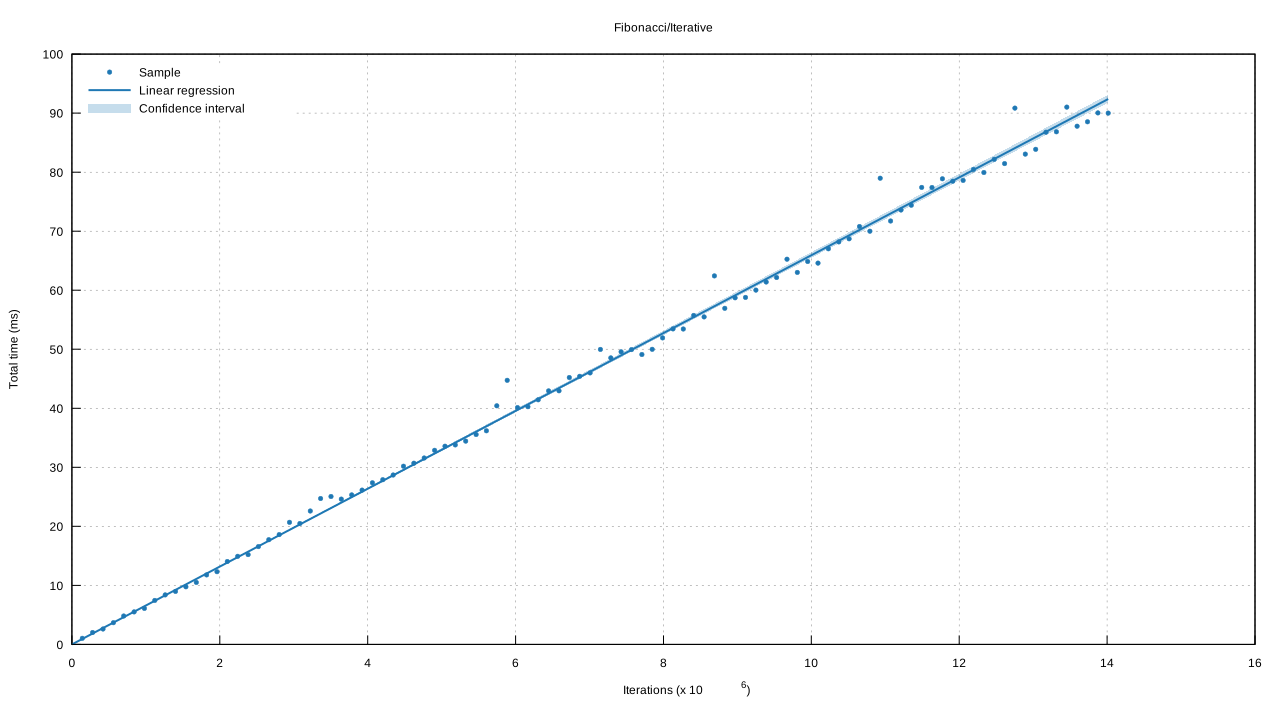
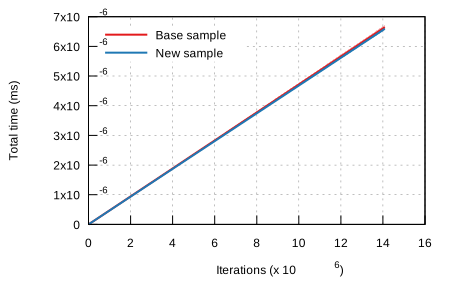
<img src="regression_small.svg" alt="Regression" width="450" height="300" />
</a>
</td>
</tr>
</tbody>
</table>
</section>
<section class="stats">
<div class="additional_stats">
<h4>Additional Statistics:</h4>
<table>
<thead>
<tr>
<th></th>
<th title="0.95 confidence level" class="ci-bound">Lower bound</th>
<th>Estimate</th>
<th title="0.95 confidence level" class="ci-bound">Upper bound</th>
</tr>
</thead>
<tbody>
<tr>
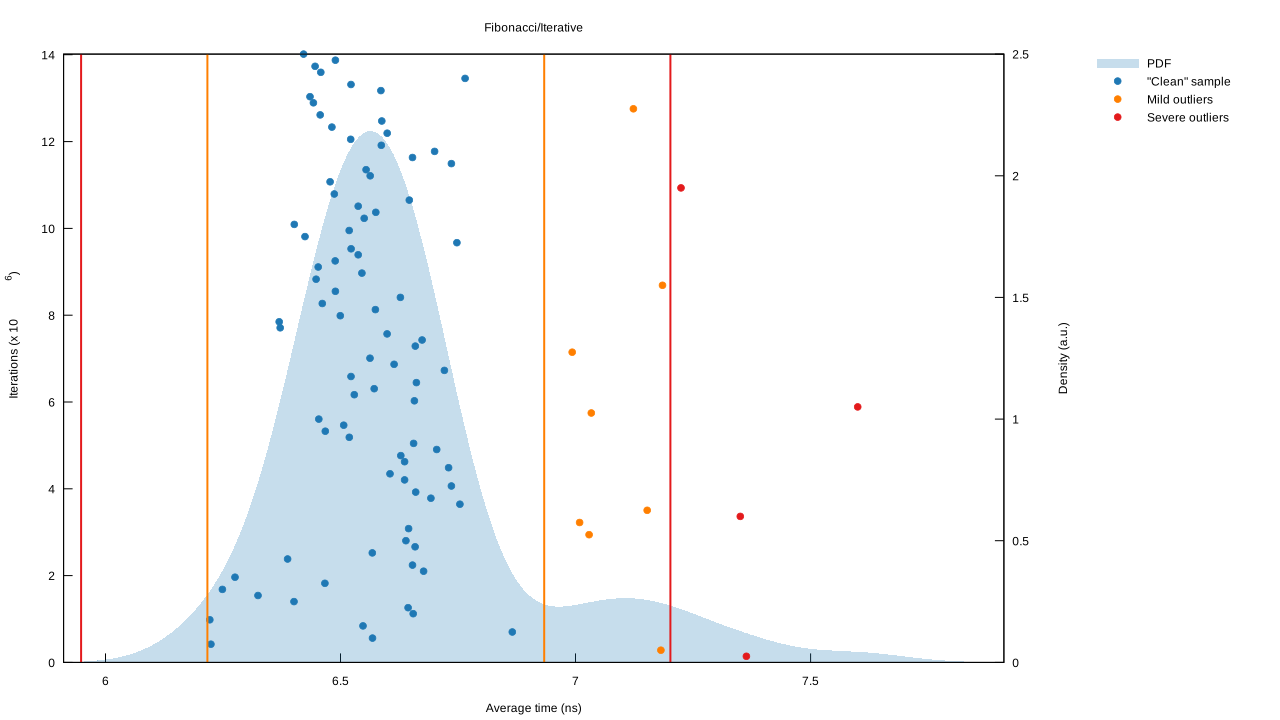
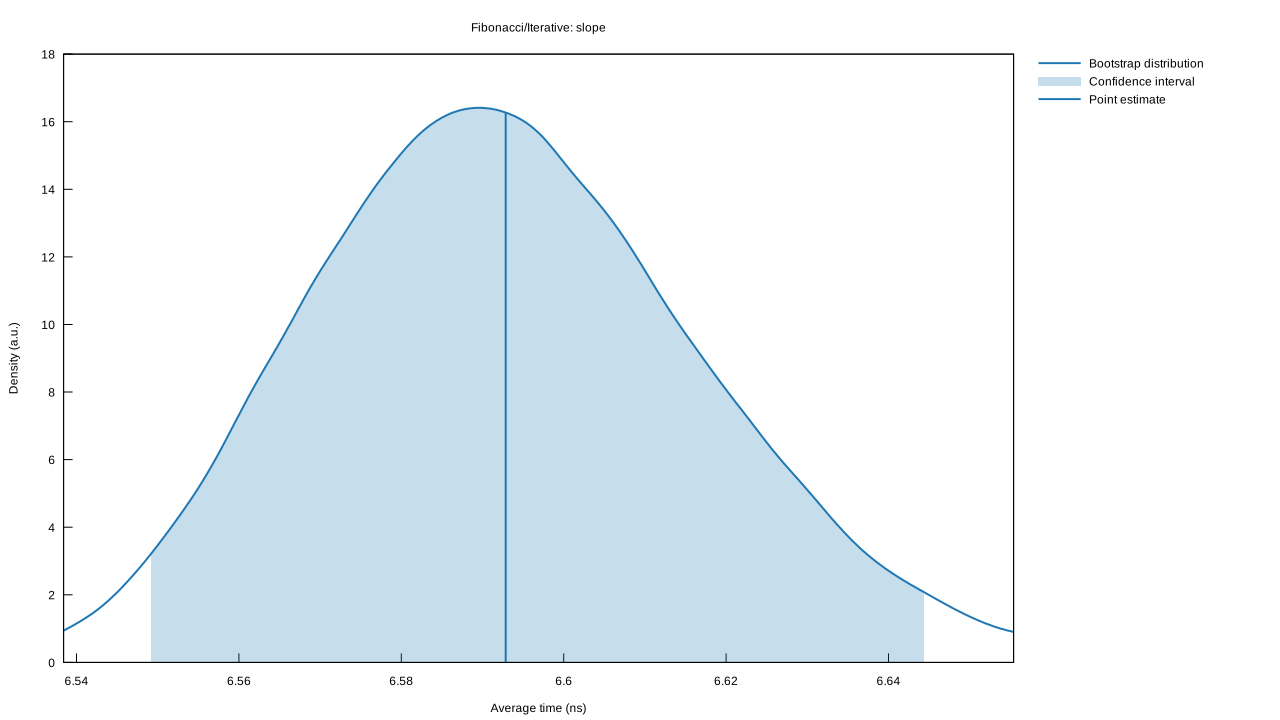
<td>Slope</td>
<td class="ci-bound">6.5490 ns</td>
<td>6.5929 ns</td>
<td class="ci-bound">6.6448 ns</td>
</tr>
<tr>
<td>R²</td>
<td class="ci-bound">0.8737515</td>
<td>0.8789941</td>
<td class="ci-bound">0.8716532</td>
</tr>
<tr>
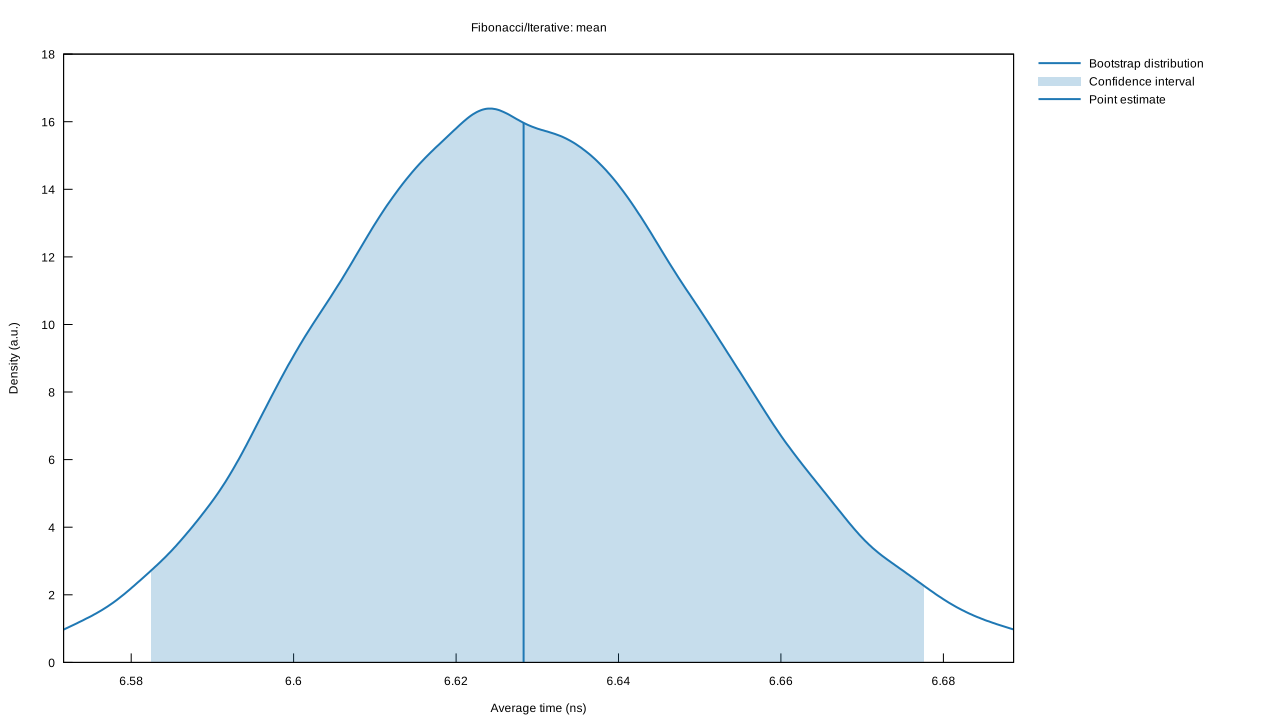
<td>Mean</td>
<td class="ci-bound">6.5823 ns</td>
<td>6.6283 ns</td>
<td class="ci-bound">6.6780 ns</td>
</tr>
<tr>
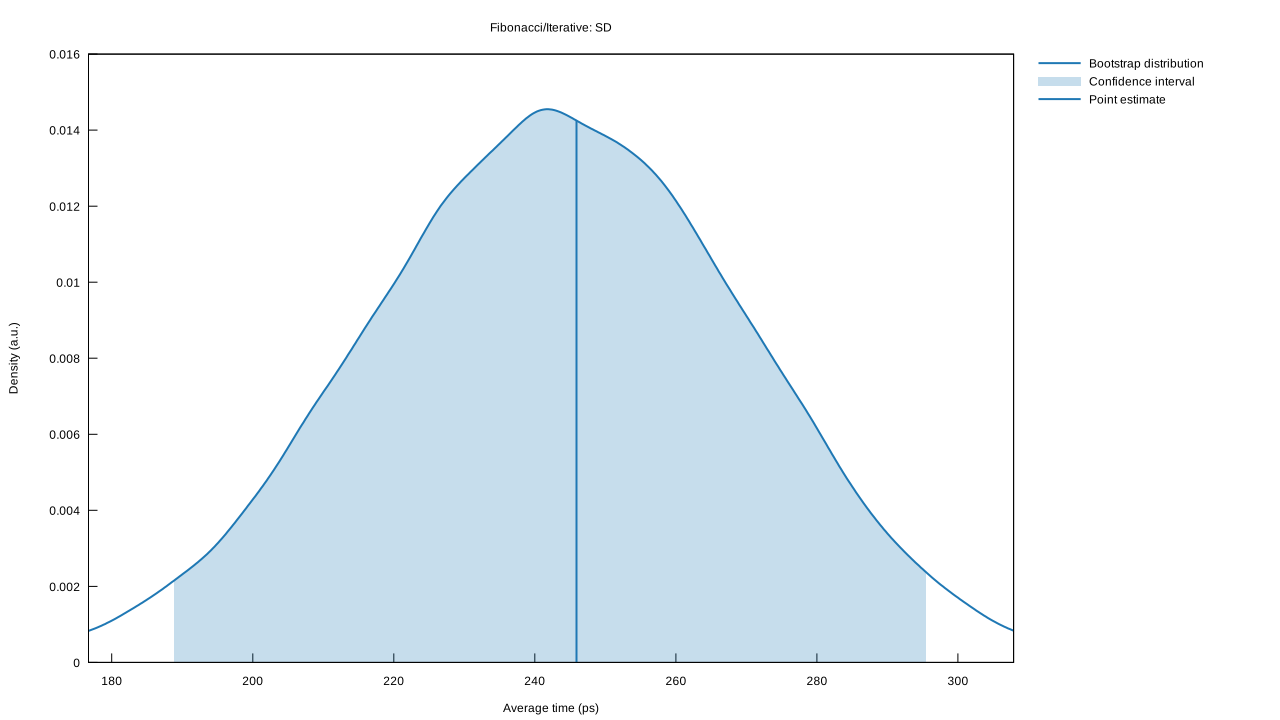
<td title="Standard Deviation">Std. Dev.</td>
<td class="ci-bound">188.63 ps</td>
<td>245.91 ps</td>
<td class="ci-bound">295.97 ps</td>
</tr>
<tr>
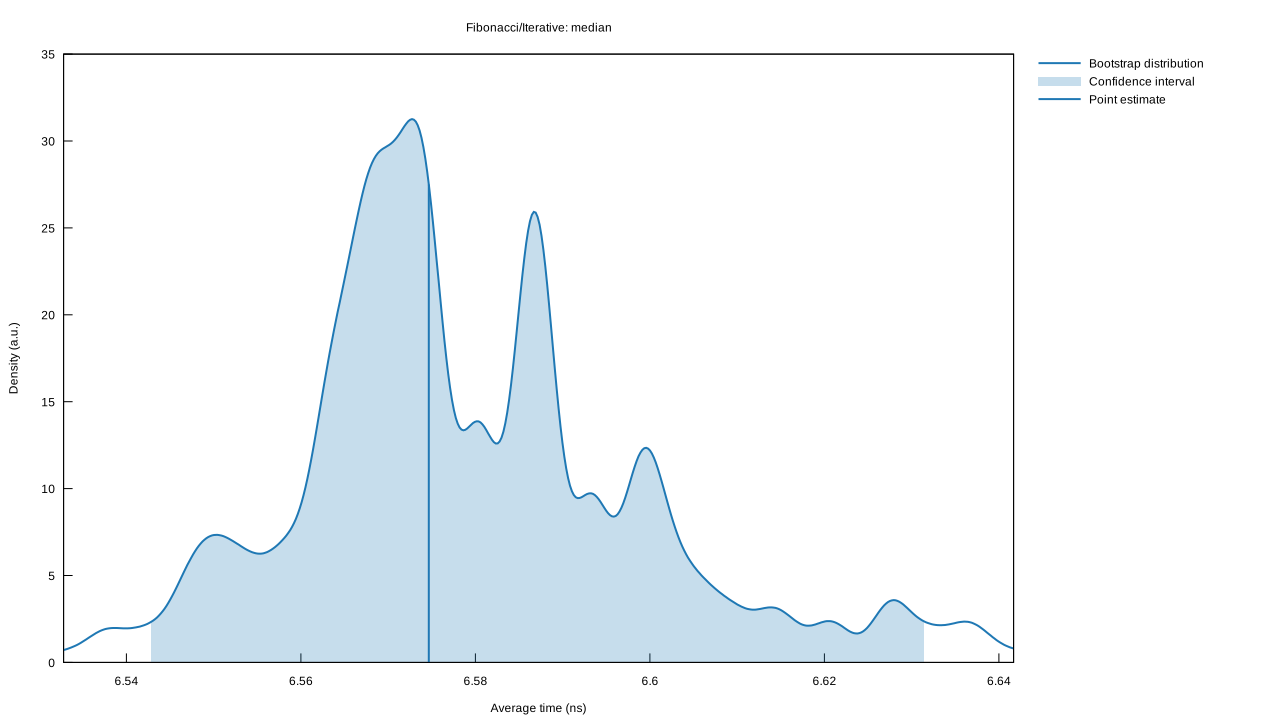
<td>Median</td>
<td class="ci-bound">6.5427 ns</td>
<td>6.5747 ns</td>
<td class="ci-bound">6.6318 ns</td>
</tr>
<tr>
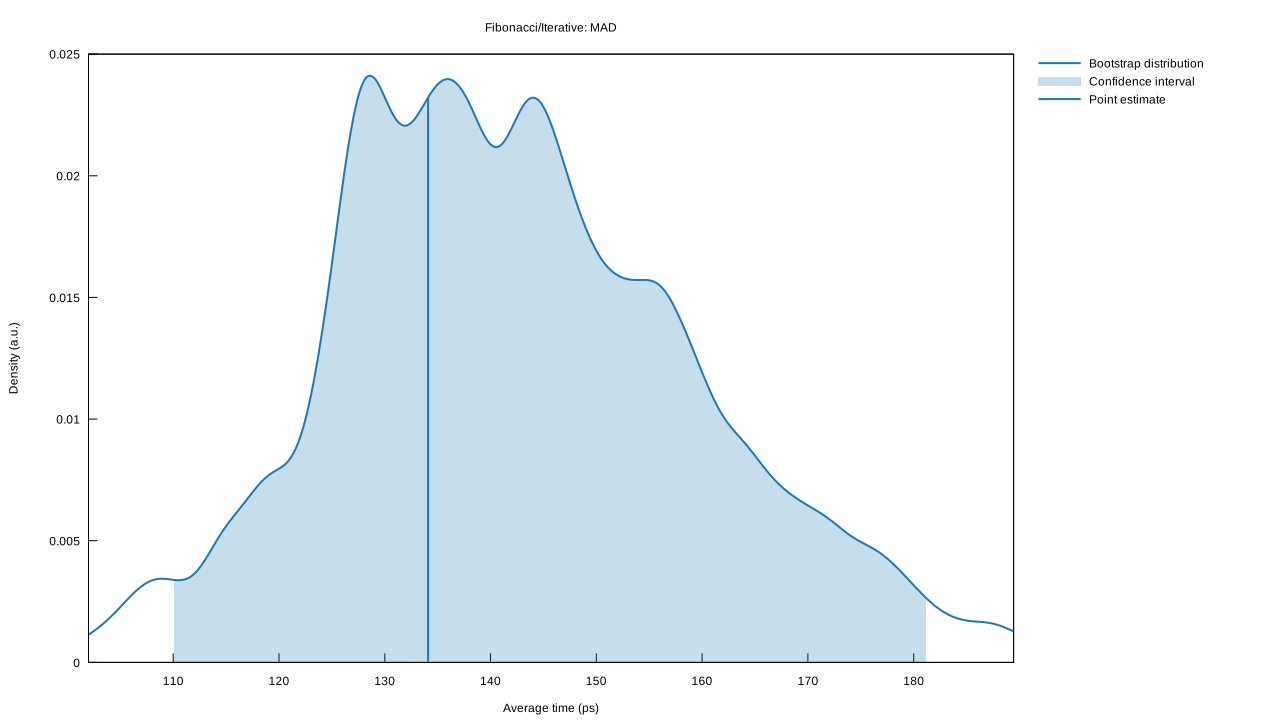
<td title="Median Absolute Deviation">MAD</td>
<td class="ci-bound">109.94 ps</td>
<td>134.10 ps</td>
<td class="ci-bound">181.50 ps</td>
</tr>
</tbody>
</table>
</div>
<div class="additional_plots">
<h4>Additional Plots:</h4>
<ul>
<li>
<a href="slope.svg">Slope</a>
</li>
<li>
<a href="mean.svg">Mean</a>
</li>
<li>
<a href="SD.svg">Std. Dev.</a>
</li>
<li>
<a href="median.svg">Median</a>
</li>
<li>
<a href="MAD.svg">MAD</a>
</li>
</ul>
</div>
</section>
</div>
<section class="plots">
<h3>Change Since Previous Benchmark</h3>
<div class="relative">
<table width="100%">
<tbody>
<tr>
<td>
<a href="../both/pdf.svg">
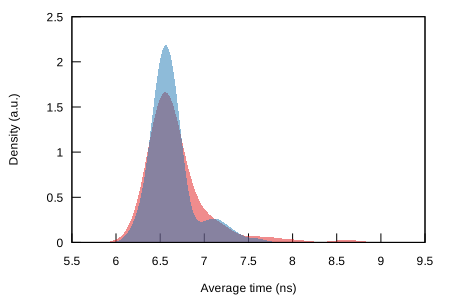
<img src="relative_pdf_small.svg" alt="PDF Comparison" width="450" height="300" />
</a>
</td>
<td>
<a href="../both/regression.svg">
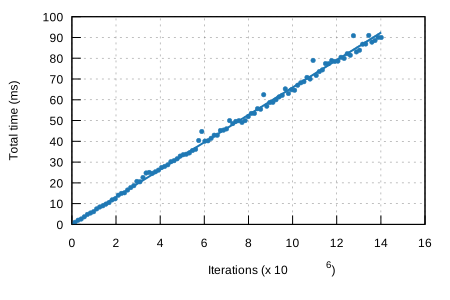
<img src="relative_regression_small.svg" alt="Regression Comparison" width="450" height="300"/>
</a>
</td>
</tr>
</tbody>
</table>
</div>
</section>
<section class="stats">
<div class="additional_stats">
<h4>Additional Statistics:</h4>
<table>
<thead>
<tr>
<th></th>
<th title="0.95 confidence level" class="ci-bound">Lower bound</th>
<th>Estimate</th>
<th title="0.95 confidence level" class="ci-bound">Upper bound</th>
<th></th>
</tr>
</thead>
<tbody>
<tr>
<td>Change</td>
<td class="ci-bound">-2.1554%</td>
<td>-0.8581%</td>
<td class="ci-bound">+0.3568%</td>
<td>(p = 0.19 > 0.05)</td>
</tr>
</tbody>
</table>
No change in performance detected.
</div>
<div class="additional_plots">
<h4>Additional Plots:</h4>
<ul>
<li>
<a href="change/mean.svg">Change in mean</a>
</li>
<li>
<a href="change/median.svg">Change in median</a>
</li>
<li>
<a href="change/t-test.svg">T-Test</a>
</li>
</ul>
</div>
</section>
</div>
<div id="footer">
<p>This report was generated by
<a href="https://github.com/bheisler/criterion.rs">Criterion.rs</a>, a statistics-driven benchmarking library in Rust.</p>
</div>
</body>
</html>