# contribution-grid
[](https://crates.io/crates/contribution-grid)
[](https://docs.rs/contribution-grid)
[](LICENSE)
A Rust crate for generating customizable, GitHub-style contribution heatmap graphs as images.
This crate provides a builder interface to create contribution heatmaps, similar to those found on GitHub user profiles. It supports custom date ranges, colors, and dimensions, outputting the result as an image.
## Usage
Add this to your project:
```bash
cargo add contribution-grid
```
## Example
```rust
use contribution_grid::{ContributionGraph, Theme, LinearStrategy};
use chrono::NaiveDate;
use std::collections::HashMap;
fn main() -> Result<(), Box<dyn std::error::Error>> {
let mut data = HashMap::new();
data.insert(NaiveDate::from_ymd_opt(2023, 1, 1).unwrap(), 5);
data.insert(NaiveDate::from_ymd_opt(2023, 1, 2).unwrap(), 12);
// Use a built-in theme with a linear mapping strategy
let img = ContributionGraph::new()
.with_data(data)
.theme(Theme::blue(LinearStrategy))
.generate();
img.save("graph.png")?;
Ok(())
}
```
## Mapping Strategies
The library supports different ways to map contribution counts to colors:
- **`LinearStrategy`**: Maps counts linearly based on the maximum count in the dataset.
- **`LogarithmicStrategy`**: Emphasizes differences at lower values.
- **`ThresholdStrategy`**: Uses fixed user-defined thresholds.
```rust
use contribution_grid::{Theme, ThresholdStrategy};
// Use fixed thresholds: 0, 1-4, 5-9, 10-19, 20+
let palette = Theme::github(ThresholdStrategy::new(vec![1, 5, 10, 20]));
```
## Themes
The library comes with several built-in themes:
### GitHub (Default)
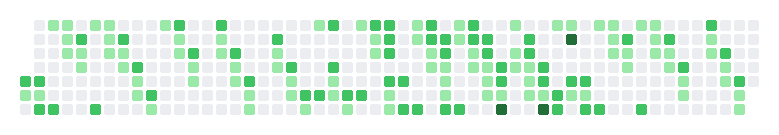
### GitHub Old

### Blue

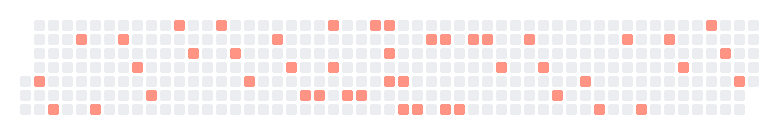
### Red
### Custom Examples
**Custom Dimensions (Small Boxes):**
You can also customize dimensions and colors via the `Palette` struct.
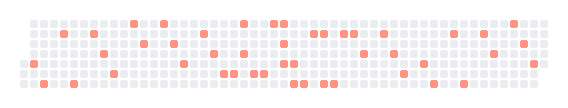
**Custom Neon Theme:**

## License
This project is licensed under the [MIT License](LICENSE).