# codepulse
A Rust CLI tool that measures the heartbeat of your codebase—analyzing git history to visualize lines of code over time.
## Features
- Analyzes any git repository
- Weekly aggregation for clear trends
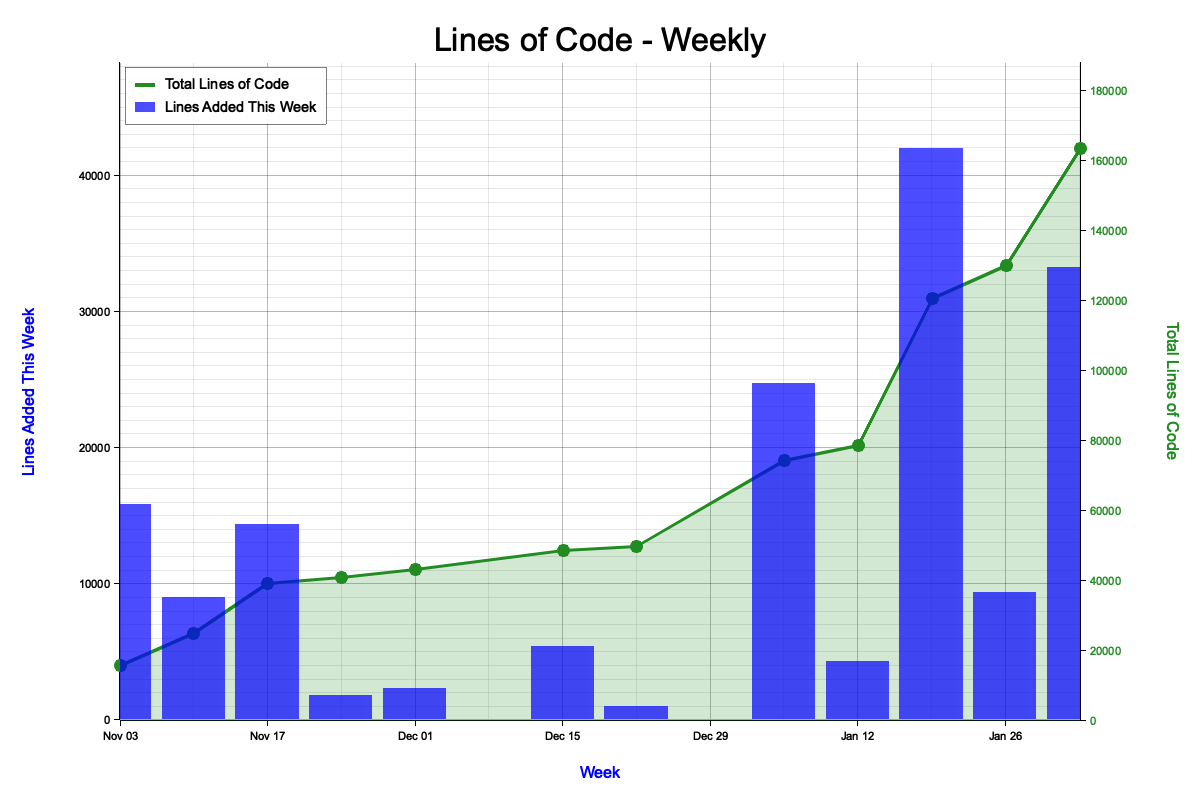
- Shows two metrics:
- **Blue bars**: Lines of code added each week
- **Green line**: Total lines of code (running total)
- Outputs a PNG chart
## Installation
```bash
cargo build --release
```
The binary will be at `target/release/codepulse`.
## Usage
```bash
codepulse [OPTIONS]
```
### Options
| `--repo` | `-r` | Path to the git repository | Current directory |
| `--output` | `-o` | Output PNG file path | `<folder-name>_loc.png` |
| `--title` | `-t` | Chart title | Folder name |
### Examples
```bash
# Analyze current directory with all defaults
codepulse
# Analyze a specific repository
codepulse --repo /path/to/my-project
# Custom title and output file
codepulse --title "My Project" --output my_chart.png
# Full customization
codepulse --repo /path/to/my-project --title "Project Stats" --output stats.png
```
## Testing Locally
Create a test repository:
```bash
mkdir /tmp/test-repo && cd /tmp/test-repo
git init
echo "line 1" > file.txt && git add . && git commit -m "First"
echo "line 2" >> file.txt && git add . && git commit -m "Second"
echo "line 3" >> file.txt && git add . && git commit -m "Third"
```
Run the analyzer:
```bash
# From within the repo (uses defaults)
codepulse
open test-repo_loc.png # macOS
# Or specify the path
cargo run -- --repo /tmp/test-repo
open test-repo_loc.png # macOS
```
## Output
The chart shows:
- **Left Y-axis (blue)**: Lines added each week
- **Right Y-axis (green)**: Total lines of code
- **Blue bars**: Weekly code additions
- **Green line + area**: Running total of all code
## License
MIT