# cargo-instruments
Easily profile your rust crate with Xcode [Instruments].
`cargo-instruments` is the glue between Cargo and Xcode's bundled profiling
suite. It allows you to easily profile any binary in your crate, generating
files that can be viewed in the Instruments app.
## Pre-requisites
### Xcode Instruments
This crate only works on macOS because it uses [Instruments] for profiling
and creating the trace file. The benefit is that Instruments provides great
templates and UI to explore the Profiling Trace.
To install Xcode Instruments, simply install the Command Line Tools:
```sh
$ xcode-select --install
```
### Compatibility
This crate works on macOS 10.13+. In practice, it transparently detects and
uses the appropriate Xcode Instruments version based on your macOS version:
either `/usr/bin/instruments` on older macOS, or starting with macOS 10.15, the
new `xcrun xctrace`.
## Installation
### brew
The simplest way to install is via Homebrew:
```sh
$ brew install cargo-instruments
```
Alternatively, you can install from source.
### Building from Source
First, ensure that you are running macOS, with Cargo, Xcode, and the Xcode
Command Line Tools installed; then install with
```sh
$ cargo install cargo-instruments
```
## Usage
### Basic
`cargo-instruments` requires a binary target to run. By default, it will try to
build the current crate's `main.rs`. You can specify an alternative binary by
using the `--bin` or `--example` flags, or a benchmark target with the `--bench`
flag.
Assuming your crate has one binary target named `mybin`, and you want to profile
using the `Allocations` Instruments template:
_Generate a new trace file_ (by default saved in `target/instruments`)
```sh
$ cargo instruments -t Allocations
```
_Open the trace file in Instruments.app_ (or pass `--open` to open automatically)
```sh
$ open target/instruments/mybin_Allocations_2021-05-09T12:34:56.trace
```
### Profiling application in release mode
When profiling the application in release mode the compiler doesn't provide
debugging symbols in the default configuration.
To let the compiler generate the debugging symbols even in release mode you
can append the following section in your `Cargo.toml`.
```toml
[profile.release]
debug = true
```
### All options
As usual, thanks to Clap, running `cargo instruments -h` prints the compact help.
cargo-instruments 0.4.0
Profile a binary with Xcode Instruments.
By default, cargo-instruments will build your main binary.
USAGE:
cargo instruments [FLAGS] [OPTIONS] [ARGS]...
FLAGS:
-h, --help Prints help information
-l, --list-templates List available templates
--open Open the generated .trace file after profiling
--release Pass --release to cargo
-V, --version Prints version information
OPTIONS:
--bench <NAME> Benchmark target to run
--bin <NAME> Binary to run
--example <NAME> Example binary to run
--features <CARGO-FEATURES> Features to pass to cargo
-t, --template <TEMPLATE> Specify the instruments template to run
--time-limit <MILLIS> Limit recording time to the specified value (in milliseconds)
-o, --output <PATH> Output .trace file to the given path
ARGS:
<ARGS>... Arguments passed to the target binary
And `cargo instruments --help` provides more detail.
### Templates
Instruments has the concept of 'templates', which describe sets of dtrace
probes that can be enabled. You can ask `cargo-instruments` to list available
templates, including your custom ones (see help above). If you don't provide a
template name, you will be prompted to choose one.
Typically, the built-in templates are
built-in abbrev
--------------------------
Activity Monitor
Allocations (alloc)
Animation Hitches
App Launch
Core Data
Counters
Energy Log
File Activity (io)
Game Performance
Leaks
Logging
Metal System Trace
Network
SceneKit
SwiftUI
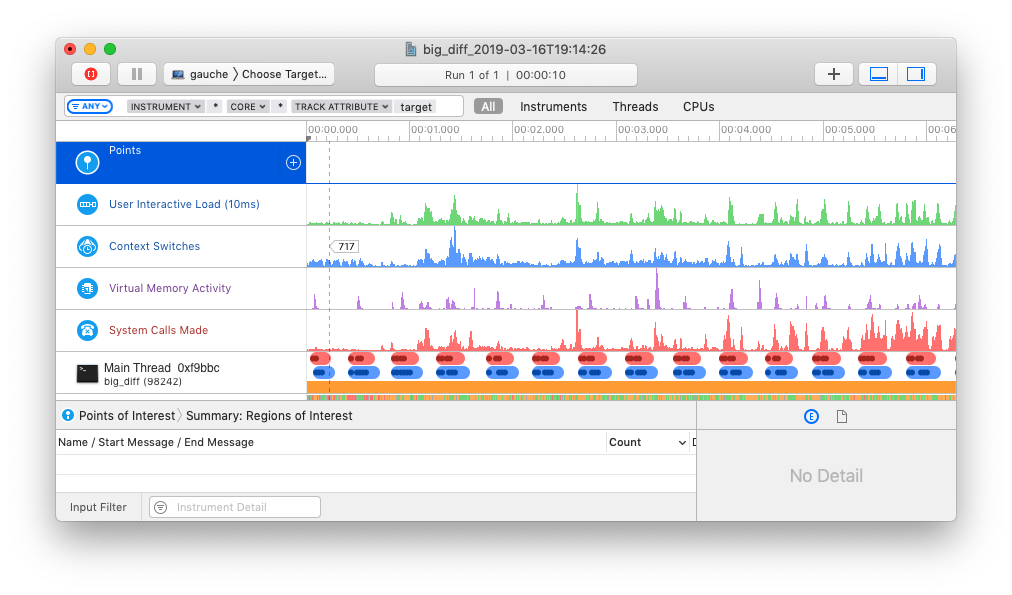
System Trace (sys)
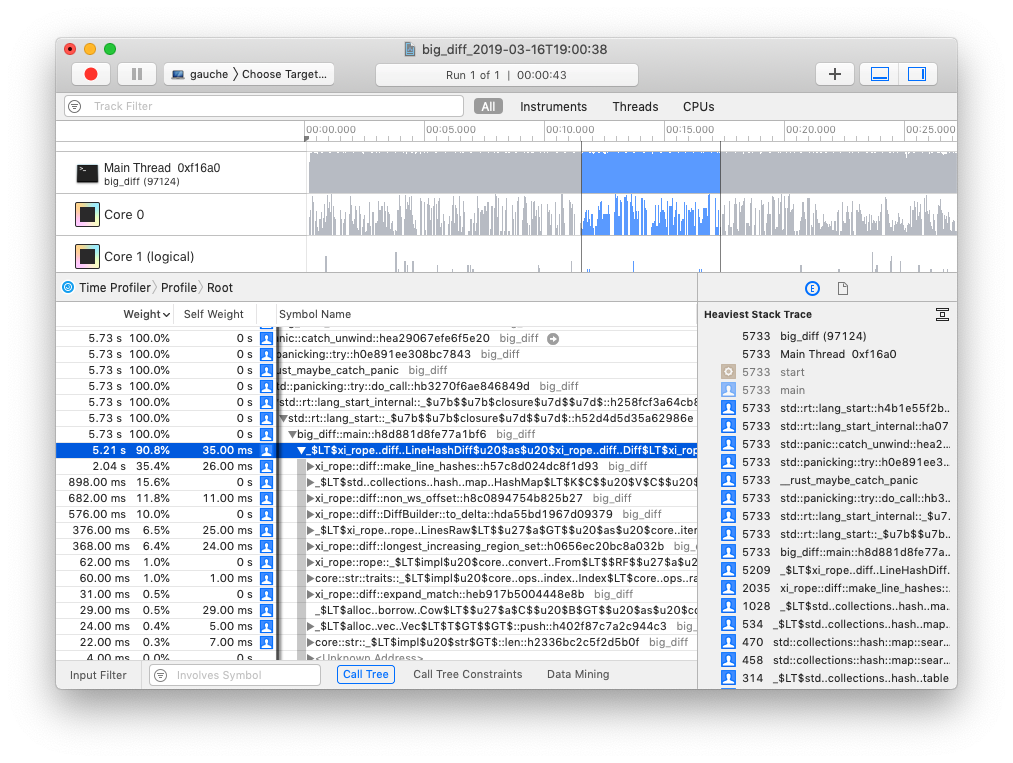
Time Profiler (time)
Zombies
### Examples
```sh
# View all args and options
$ cargo instruments --help
```
```sh
# View all built-in and custom templates
$ cargo instruments --list-templates
```
```sh
# profile the main binary with the Allocations template
$ cargo instruments -t alloc
```
```sh
# profile examples/my_example.rs, with the Allocations template,
# for 10 seconds, and open the trace when finished
$ cargo instruments -t Allocations --example my_example --time-limit 10000 --open
```
```sh
# omitting to provide a template will display an interactive menu
# to choose which template to use for profiling
$ cargo instruments
```
## Resources
[Instruments Help][instruments]
### WWDC videos
The best source of information about Instruments is likely the various WWDC
sessions over the years:
- [Profiling in Depth](https://developer.apple.com/videos/play/wwdc2015/412/)
- [Using Time Profiler in Instruments](https://developer.apple.com/videos/play/wwdc2016/418/)
- [System Trace in Depth](https://developer.apple.com/videos/play/wwdc2016/411/)
- [Creating Custom Instruments](https://developer.apple.com/videos/play/wwdc2018/410/)
[instruments]: https://help.apple.com/instruments/mac/10.0/
[time profiler]: https://help.apple.com/instruments/mac/10.0/#/dev44b2b437