# cargo-instruments
Easily generate [Instruments] traces for your rust crate.
`cargo-instruments` is the glue between cargo and Xcode's bundled profiling
suite. It allows you to easily profile any binary in your crate, generating
files that can be viewed in the Instruments app.
## Installation
### brew
```bash
brew install cargo-instruments
```
### Building from Source
First, ensure that you are running macOS, with Cargo, Xcode, and the Xcode
Command Line Tools installed; then install with
```bash
cargo install cargo-instruments
```
## Use
### basic usage
`cargo-instruments` requires a binary target to run. By default, it will try to
build the current crate's `main.rs`. You can specify an alternative binary by
using the `--bin` or `--example` flags, or a benchmark target with the `--bench`
flag.
_Generate a new trace file_ (by default saved in `/target/instruments`)
```sh
$ cargo instruments [-t template] [--bin foo | --example bar] [--out out_file]
```
_Open the file in Instruments.app_ (or pass `--open` to open automatically)
```sh
$ open target/instruments/my_bin_YYYY-MM-DD-THH:MM:SS.trace
```
### Profiling application in release mode
When profiling the application in release mode the compiler doesn't provide
debugging symbols in the default configuration.
To let the compiler generate the debugging symbols even in release mode you
can append the following section in your `Cargo.toml`.
```toml
[profile.release]
debug = true
```
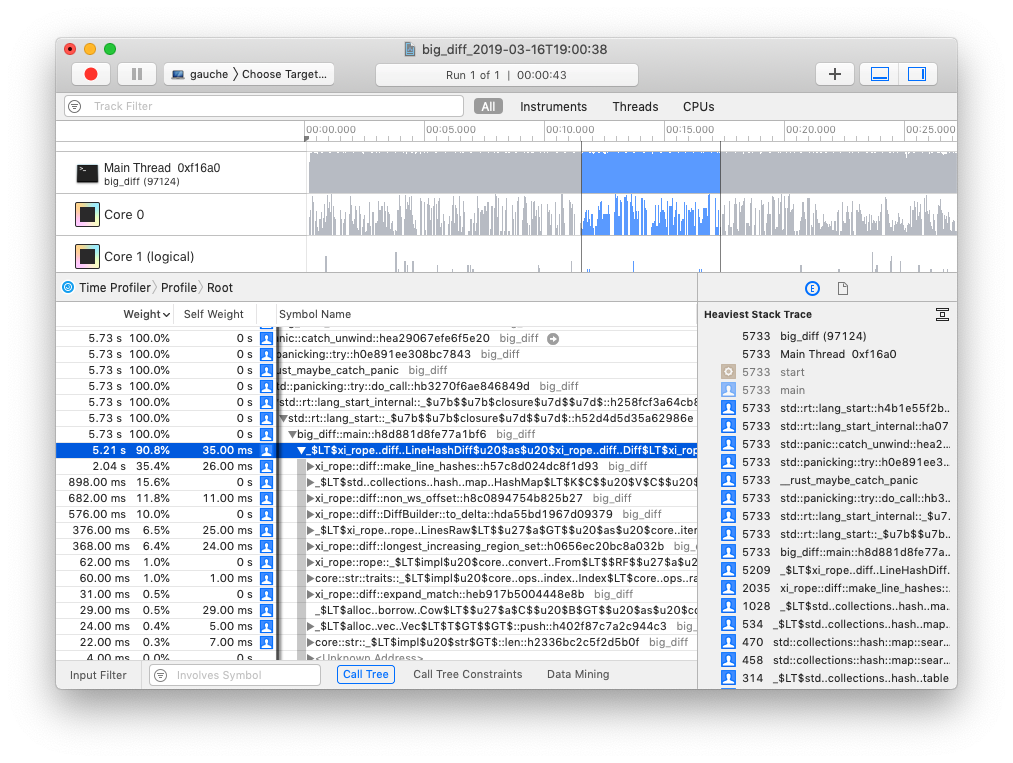
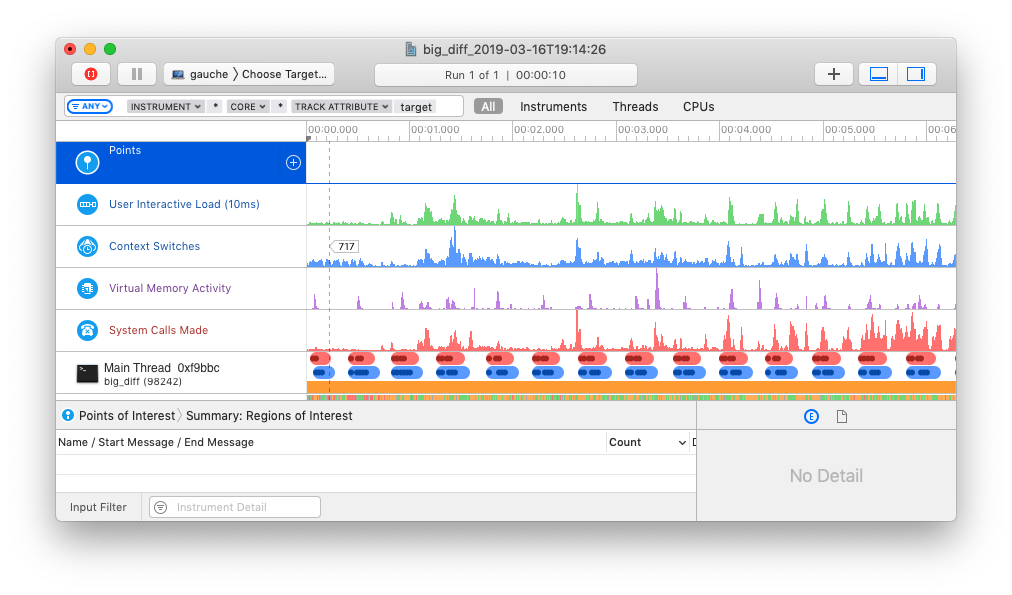
### Templates
Instruments has the concept of 'templates', which describe sets of dtrace probes
that can be enabled. `cargo-instruments` will use the "[Time
Profiler][time profiler]", which collects CPU core and thread use.
### examples
```sh
# View all args and options
$ cargo instruments --help
```
```sh
# profile the main binary with the Allocations template
$ cargo instruments -t alloc
```
```sh
# profile examples/my_example.rs, with the default template,
# for 10 seconds, and open the trace when finished
$ cargo instruments --example my_example --limit 10000 --open
```
## Resources
[Instruments Help][instruments]
### WWDC videos
The best source of information about Instruments is likely the various WWDC
sessions over the years:
- [Profiling in Depth](https://developer.apple.com/videos/play/wwdc2015/412/)
- [Using Time Profiler in Instruments](https://developer.apple.com/videos/play/wwdc2016/418/)
- [System Trace in Depth](https://developer.apple.com/videos/play/wwdc2016/411/)
- [Creating Custom Instruments](https://developer.apple.com/videos/play/wwdc2018/410/)
[instruments]: https://help.apple.com/instruments/mac/10.0/
[time profiler]: https://help.apple.com/instruments/mac/10.0/#/dev44b2b437