# Box Plot Chart Generator
[](https://github.com/jlyonsmith/box_plot_chart/blob/main/coverage.json)
[](https://crates.io/crates/box_plot_chart)
[](https://docs.rs/box_plot_chart)
This is a simple box plot generator. You provide a [JSON5](https://json5.org/) file with data and it generates an SVG file. You can convert the SVG to PNG or other bitmap formats with the [resvg](https://crates.io/crates/resvg) tool.
Here is an example of the output:

Install with `cargo install box_plot_chart`. Run with `box-plot-chart`.
Features of the tool include:
- Automatic scaling of the Y axis labels
- Shows box, whiskers and outliers
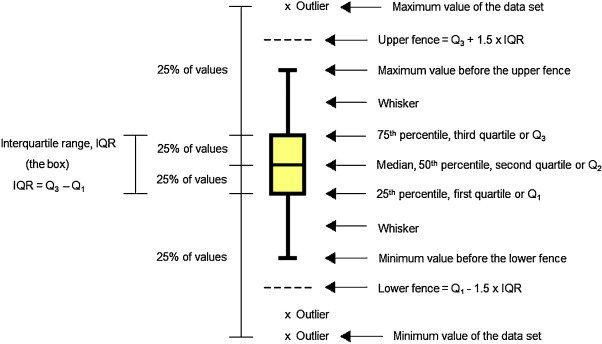
You can understand the box plot composition with the aid of the following graphic: