# Examples
## Basic Usage
### 1. Monitor with auto-detected interface
```bash
bandwidthmon
```
This will automatically select the network interface with the most traffic.
### 2. Monitor specific interface
```bash
# Ethernet
bandwidthmon -i eth0
# WiFi
bandwidthmon -i wlan0
# Loopback
bandwidthmon -i lo
```
### 3. List available interfaces
```bash
bandwidthmon -l
```
Output:
```
Available Network Interfaces:
────────────────────────────────────────────────────────────────────────────────
eth0 (RX: 1234567890 bytes, TX: 987654321 bytes)
wlan0 (RX: 5678901234 bytes, TX: 4321098765 bytes)
lo (RX: 1000 bytes, TX: 1000 bytes)
```
## Chart Customization
### 4. Custom chart height
```bash
# Tall chart (20 lines)
bandwidthmon -H 20
# Short chart (5 lines)
bandwidthmon -H 5
```
### 5. Custom chart width
```bash
# Fixed width of 100 columns
bandwidthmon -W 100
# Auto-fit terminal width (default)
bandwidthmon -W 0
```
### 6. Combined size settings
```bash
bandwidthmon -H 15 -W 80
```
## Display Modes
### 7. Show only download
```bash
bandwidthmon -d
```
Output:
```
═══ Bandwidth Monitor (eth0) ═══
Download: 1.24 MB/s │ Upload: 456.78 KB/s
DOWNLOAD
1.50 │
1.25 │ ╭─╮
1.00 │ ╭─╯ ╰─╮
0.75 │ ╭─╯ ╰─╮
0.50 │╭─╯ ╰─╮
0.25 ╰╯ ╰─
Press 'q' or Ctrl+C to quit
```
### 8. Show only upload
```bash
bandwidthmon -u
```
### 9. Show both (default)
```bash
bandwidthmon
```
### 10. Enable summary statistics
```bash
bandwidthmon -s
```
Output:
```
═══ Bandwidth Monitor (eth0) ═══
Download: 1.24 MB/s │ Upload: 456.78 KB/s
Peak DL: 2.50 MB/s │ Peak UL: 1.00 MB/s
Avg DL: 1.15 MB/s │ Avg UL: 450.00 KB/s
Total RX: 1.25 GB │ Total TX: 456.78 MB
Runtime: 125.5s
DOWNLOAD
...
UPLOAD
...
Press 'q' or Ctrl+C to quit
```
## Advanced Usage
### 11. Monitor with all options
```bash
bandwidthmon -i eth0 -H 15 -W 100 -s -d
```
This will:
- Monitor `eth0` interface
- Use 15 lines for chart height
- Use 100 columns for chart width
- Show summary statistics
- Show only download chart
### 12. Monitor WiFi with custom settings
```bash
bandwidthmon -i wlan0 -H 20 -s
```
### 13. Quick bandwidth check
```bash
# Show only download with summary
bandwidthmon -d -s
# Show only upload with summary
bandwidthmon -u -s
```
### 14. Custom history size
```bash
# Keep 300 data points (5 minutes)
bandwidthmon --history 300
# Keep 60 data points (1 minute)
bandwidthmon --history 60
```
## Using bandwidthmon2 (Manual Rendering)
All examples work the same with `bandwidthmon2`:
```bash
# Basic usage
bandwidthmon2
# With options
bandwidthmon2 -i eth0 -H 20 -s
# Custom rendering with full options
bandwidthmon2 -i wlan0 -H 15 -W 100 -s -d
```
## Real-world Scenarios
### 15. Monitoring during downloads
```bash
# Start monitoring before download
bandwidthmon -d -s
# Then start your download in another terminal
# Watch real-time bandwidth usage
```
### 16. Checking upload during backup
```bash
# Monitor upload only
bandwidthmon -u -s
# Start backup in another terminal
# Monitor upload speed
```
### 17. Comparing interfaces
```bash
# Terminal 1
bandwidthmon -i eth0
# Terminal 2
bandwidthmon -i wlan0
# Compare performance side by side
```
### 18. Debugging network issues
```bash
# Monitor with tall chart for better visibility
bandwidthmon -H 25 -s
# Watch for:
# - Sudden drops in bandwidth
# - Consistent low speeds
# - High peak vs low average (unstable connection)
```
### 19. Server monitoring
```bash
# Monitor server interface with wide chart
bandwidthmon -i eth0 -H 10 -W 120 -s
# Useful for:
# - Web server traffic monitoring
# - Database replication monitoring
# - Backup job monitoring
```
### 20. Data usage tracking
```bash
# Run for extended period with summary
bandwidthmon -s
# Check Total RX/TX at end of session
# Calculate data usage over time
```
## Tips and Tricks
### Terminal resize handling
The charts automatically adjust to terminal width changes (when using `-W 0`).
### Keyboard shortcuts
- `q` - Quit
- `Q` - Quit
- `Esc` - Quit
- `Ctrl+C` - Quit
### Performance tuning
For long monitoring sessions:
```bash
# Reduce history to save memory
bandwidthmon --history 60
# Reduce chart height for faster rendering
bandwidthmon -H 5
```
### Color schemes
The tool uses:
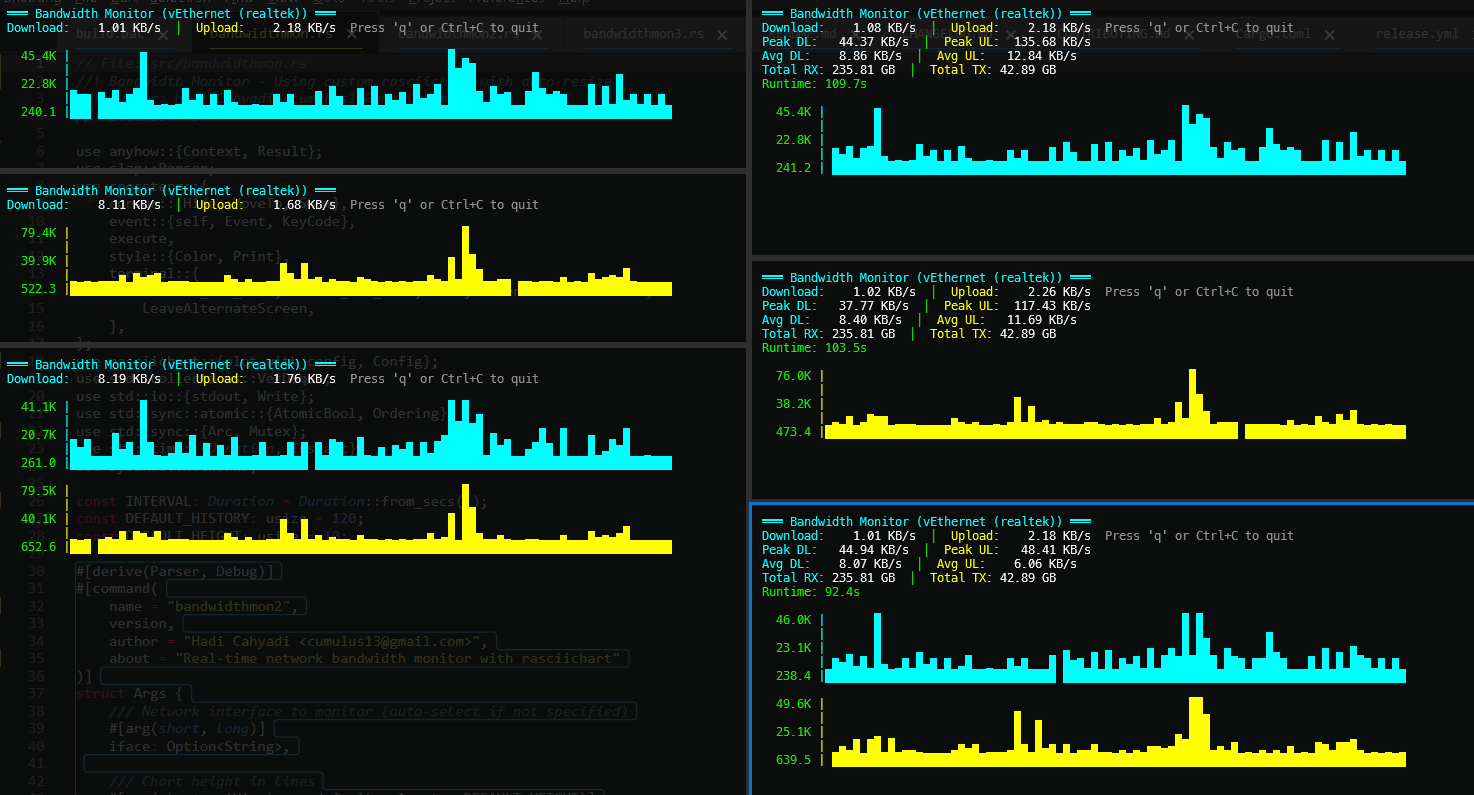
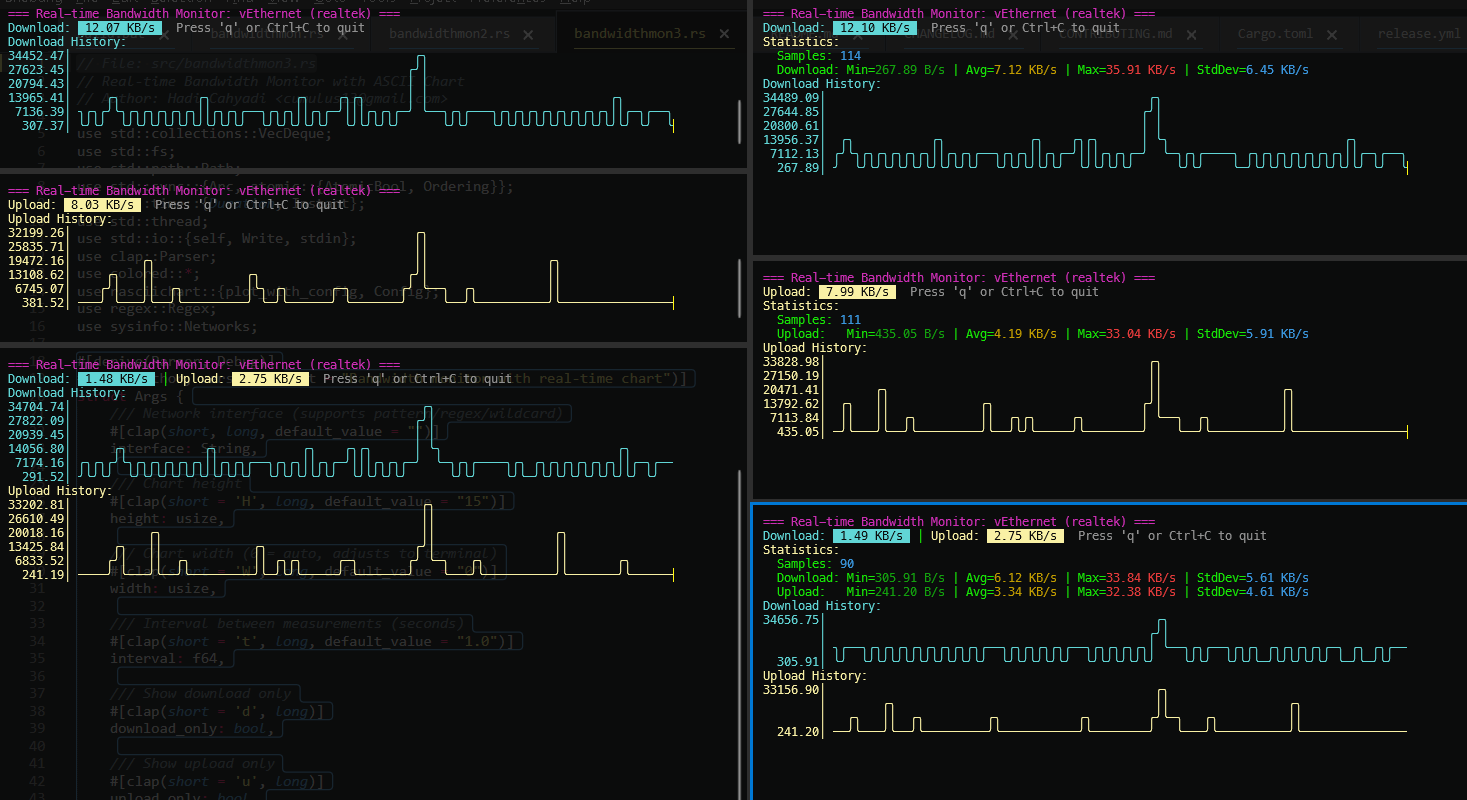
- Cyan for download
- Yellow for upload
- White for values
- Green for positive indicators
### Best practices
1. **Always use `-s` for production monitoring** - Summary statistics help identify trends
2. **Use `-d` or `-u` to focus** - Reduces visual clutter when you only care about one direction
3. **Adjust `-H` based on terminal** - Taller terminals benefit from taller charts
4. **Let `-W 0` auto-size** - Unless you need consistent output for screenshots
5. **Use `--history` wisely** - More history = more memory usage
## Troubleshooting
### Interface not found
```bash
# List interfaces first
bandwidthmon -l
# Then use exact name
bandwidthmon -i <exact-interface-name>
```
### Chart looks distorted
```bash
# Increase width
bandwidthmon -W 100
# Decrease height
bandwidthmon -H 8
```
### Terminal too small
```bash
# Use minimal settings
bandwidthmon -H 5 -W 50
```