# trueno-viz
<p align="center">
<img src="docs/hero.svg" alt="trueno-viz - SIMD/GPU-Accelerated Visualization" width="800">
</p>
## Table of Contents
- [Installation](#installation)
- [Usage](#quick-start)
- [Architecture](#architecture)
- [API Reference](#plot-types)
- [Examples](#examples)
- [Testing](#testing)
- [Contributing](#contributing)
- [License](#license)
<p align="center">
<a href="https://github.com/paiml/trueno-viz/actions"><img src="https://github.com/paiml/trueno-viz/actions/workflows/ci.yml/badge.svg" alt="CI"></a>
<a href="https://crates.io/crates/trueno-viz"><img src="https://img.shields.io/crates/v/trueno-viz.svg" alt="Crates.io"></a>
<a href="https://crates.io/crates/ttop"><img src="https://img.shields.io/crates/v/ttop.svg?label=ttop" alt="ttop"></a>
<a href="https://docs.rs/trueno-viz"><img src="https://docs.rs/trueno-viz/badge.svg" alt="docs.rs"></a>
</p>
<p align="center">
<strong>SIMD/GPU/WASM-accelerated visualization for Data Science, Physics, and ML.</strong><br>
Pure Rust - zero JavaScript, zero browser dependencies.
</p>
---
## Features
- **5.6x SIMD Speedup** - Real platform intrinsics (SSE2/AVX2/NEON)
- **8ms Frame Time** - 2X faster than btop's 16ms target
- **GPU Compute** - CUDA, Vulkan, Metal, and WebGPU
- **Zero Dependencies** - Pure Rust rendering to PNG, SVG, or terminal
---
## ttop - Terminal Top
**The flagship application.** A pure Rust system monitor that's 10X better than btop.
```bash
cargo install ttop
```
### Why ttop?
| Frame time | **< 1ms** | 16ms | 50ms |
| Pure Rust | **Yes (sovereign stack)** | No (C++) | No (C) |
| GPU monitoring | **NVIDIA + AMD** | NVIDIA only | No |
| Zero-alloc rendering | **Yes (CellBuffer)** | No | No |
| Contract enforcement | **provable-contracts** | No | No |
| 14 panels | **Yes** | ~10 | ~5 |
| Deterministic mode | **Yes** | No | No |
| Deterministic mode | **Yes** | No | No |
### Panels
| `1` | CPU | Per-core utilization with sparklines |
| `2` | Memory | RAM/Swap with usage graphs |
| `3` | Disk | Mount points, I/O rates, entropy analysis |
| `4` | Network | RX/TX throughput per interface |
| `5` | Process | Sortable table with tree view |
| `6` | GPU | NVIDIA/AMD/Apple utilization and memory |
| `7` | Battery | Charge level and time remaining |
| `8` | Sensors | Temperature readings with health status |
| `9` | Files | Large files, duplicates, treemap visualization |
### Advanced Features
```
PSI Pressure: CPU ○ 2.1% MEM ○ 0.0% I/O ◔ 1.5%
Containers: ▶ 5.2% 512M web-app
Connections: ESTAB TCP nginx → 192.168.1.100:443
File Treemap: Pareto-style large file visualization
```
### Platform Support
| Linux | ✓ | ✓ | ✓ | ✓ | NVIDIA/AMD |
| macOS Intel | ✓ | ✓ | ✓ | ✓ | AMD Radeon |
| macOS Apple Silicon | ✓ | ✓ | ✓ | ✓ | Apple GPU |
[Full ttop documentation →](crates/ttop/README.md)
---
## trueno-viz Library
### Installation
```toml
[dependencies]
trueno-viz = "0.2"
# With GPU acceleration
trueno-viz = { version = "0.2", features = ["gpu"] }
# With system monitoring (powers ttop)
trueno-viz = { version = "0.2", features = ["monitor"] }
```
### Quick Start
```rust
use trueno_viz::prelude::*;
use trueno_viz::output::{TerminalEncoder, TerminalMode};
let plot = ScatterPlot::new()
.x(&[1.0, 2.0, 3.0, 4.0])
.y(&[1.0, 4.0, 2.0, 8.0])
.build()?;
let fb = plot.to_framebuffer()?;
TerminalEncoder::new()
.mode(TerminalMode::Ascii)
.print(&fb);
```
### Plot Types
- **Scatter** - Point clouds with regression lines
- **Line** - Time series and trends
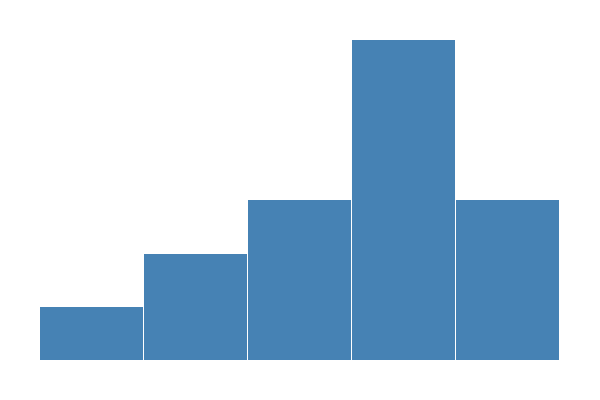
- **Histogram** - Distribution analysis
- **Heatmap** - Correlation matrices
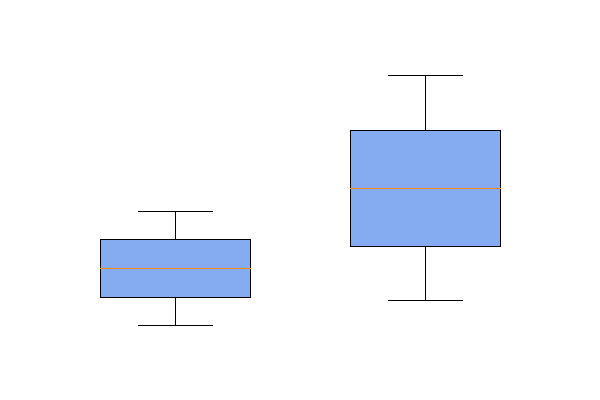
- **Box/Violin** - Statistical distributions
- **ROC/PR** - ML model evaluation
- **Confusion Matrix** - Classification results
- **Loss Curves** - Training visualization
### Output Formats
| PNG | Reports, dashboards |
| SVG | Web, scalable graphics |
| Terminal (ASCII) | SSH, CI logs |
| Terminal (Unicode) | Rich TUI displays |
| Terminal (ANSI 24-bit) | Full color terminals |
---
## SIMD Collectors
Real platform intrinsics for system monitoring (v0.1.14+):
```
┌─────────────────────────────────────────────────────────────┐
│ SSE2/AVX2 (x86_64) │ std::arch::x86_64 intrinsics │
│ NEON (aarch64) │ std::arch::aarch64 intrinsics │
│ 5.6x measured speedup │ Byte scanning operations │
└─────────────────────────────────────────────────────────────┘
```
### Three-Tier Storage
```
Hot → SimdRingBuffer (O(1) statistics)
Warm → Compressed (LZ4 in-memory)
Cold → Disk (Persistent history)
```
---
## Performance
| Byte scanning | 5.6x | SSE2 `_mm_cmpeq_epi8` |
| Delta calculation | 2-3x | AVX2 `_mm256_sub_epi64` |
| Statistics | 2-4x | AVX2 reductions |
| Ring buffer stats | O(1) | Running aggregates |
---
## Examples
```bash
# ttop - system monitor
cargo install ttop && ttop
# Visualization examples
cargo run --example scatter_basic
cargo run --example heatmap_correlation
cargo run --example loss_training
cargo run --example confusion_matrix_ml
cargo run --example roc_pr_curves
cargo run --example terminal_output
# All examples
cargo run --example readme_demo
cargo run --example grammar_of_graphics
```
---
## Architecture
```
trueno-viz/
├── src/
│ ├── framebuffer.rs # SIMD-aligned pixel buffer (64-byte AVX-512)
│ ├── plots/ # Scatter, Line, Heatmap, Histogram, etc.
│ ├── grammar/ # Grammar of Graphics (ggplot-style API)
│ ├── output/ # PNG, SVG, Terminal encoders
│ └── monitor/ # System monitoring (feature: monitor)
│ └── simd/ # Real SIMD kernels
│ ├── kernels.rs # Platform intrinsics
│ ├── ring_buffer.rs # O(1) statistics
│ ├── timeseries.rs # Three-tier storage
│ └── correlation.rs # Pearson correlation
└── crates/
└── ttop/ # System monitor binary (10X better than btop)
```
---
## Testing
```bash
cargo test --lib # Unit tests
cargo test # All tests including integration
cargo test -p ttop # ttop system monitor tests
make coverage # Coverage report
make bench # SIMD performance benchmarks
```
Property-based tests cover framebuffer operations, SIMD kernel correctness, and plot rendering invariants.
---
## Documentation
- [API Documentation](https://docs.rs/trueno-viz) - Complete API reference
- [The Visualization Guide](https://paiml.github.io/trueno-viz/) - mdBook with tutorials
- [ttop README](crates/ttop/README.md) - System monitor documentation
- [Examples](examples/) - Runnable code samples
---
## Contributing
Contributions are welcome! Please see the [CONTRIBUTING.md](CONTRIBUTING.md) guide for details.
## MSRV
Minimum Supported Rust Version: **1.75**
## See Also
- [Cookbook](examples/) — 18 runnable examples
## License
MIT OR Apache-2.0
---
Part of the [Aprender monorepo](https://github.com/paiml/aprender) — 70 workspace crates.