


📉 The Problem: No Observability for Context Compaction
Modern AI coding agents rely on context window compaction by design. It is a standard mechanism across Claude Code, Codex, and Gemini.
The problem is not that compaction happens.
The problem is that you cannot:
- observe when compaction occurs
- measure how much context was discarded
- correlate compaction with regressions, hallucinations, or sudden behavioral shifts
In practice, we are running a lossy, stateful system without logs, metrics, or traces for its most critical state transition.
⚡ The Solution: agtrace
agtrace adds the missing observability layer to AI coding agents.
By normalizing provider logs and exposing real-time context usage and compaction behavior, agtrace makes agent state transitions inspectable and debuggable — without sending sensitive data to the cloud.

Live demo of agtrace watch — real-time session monitoring
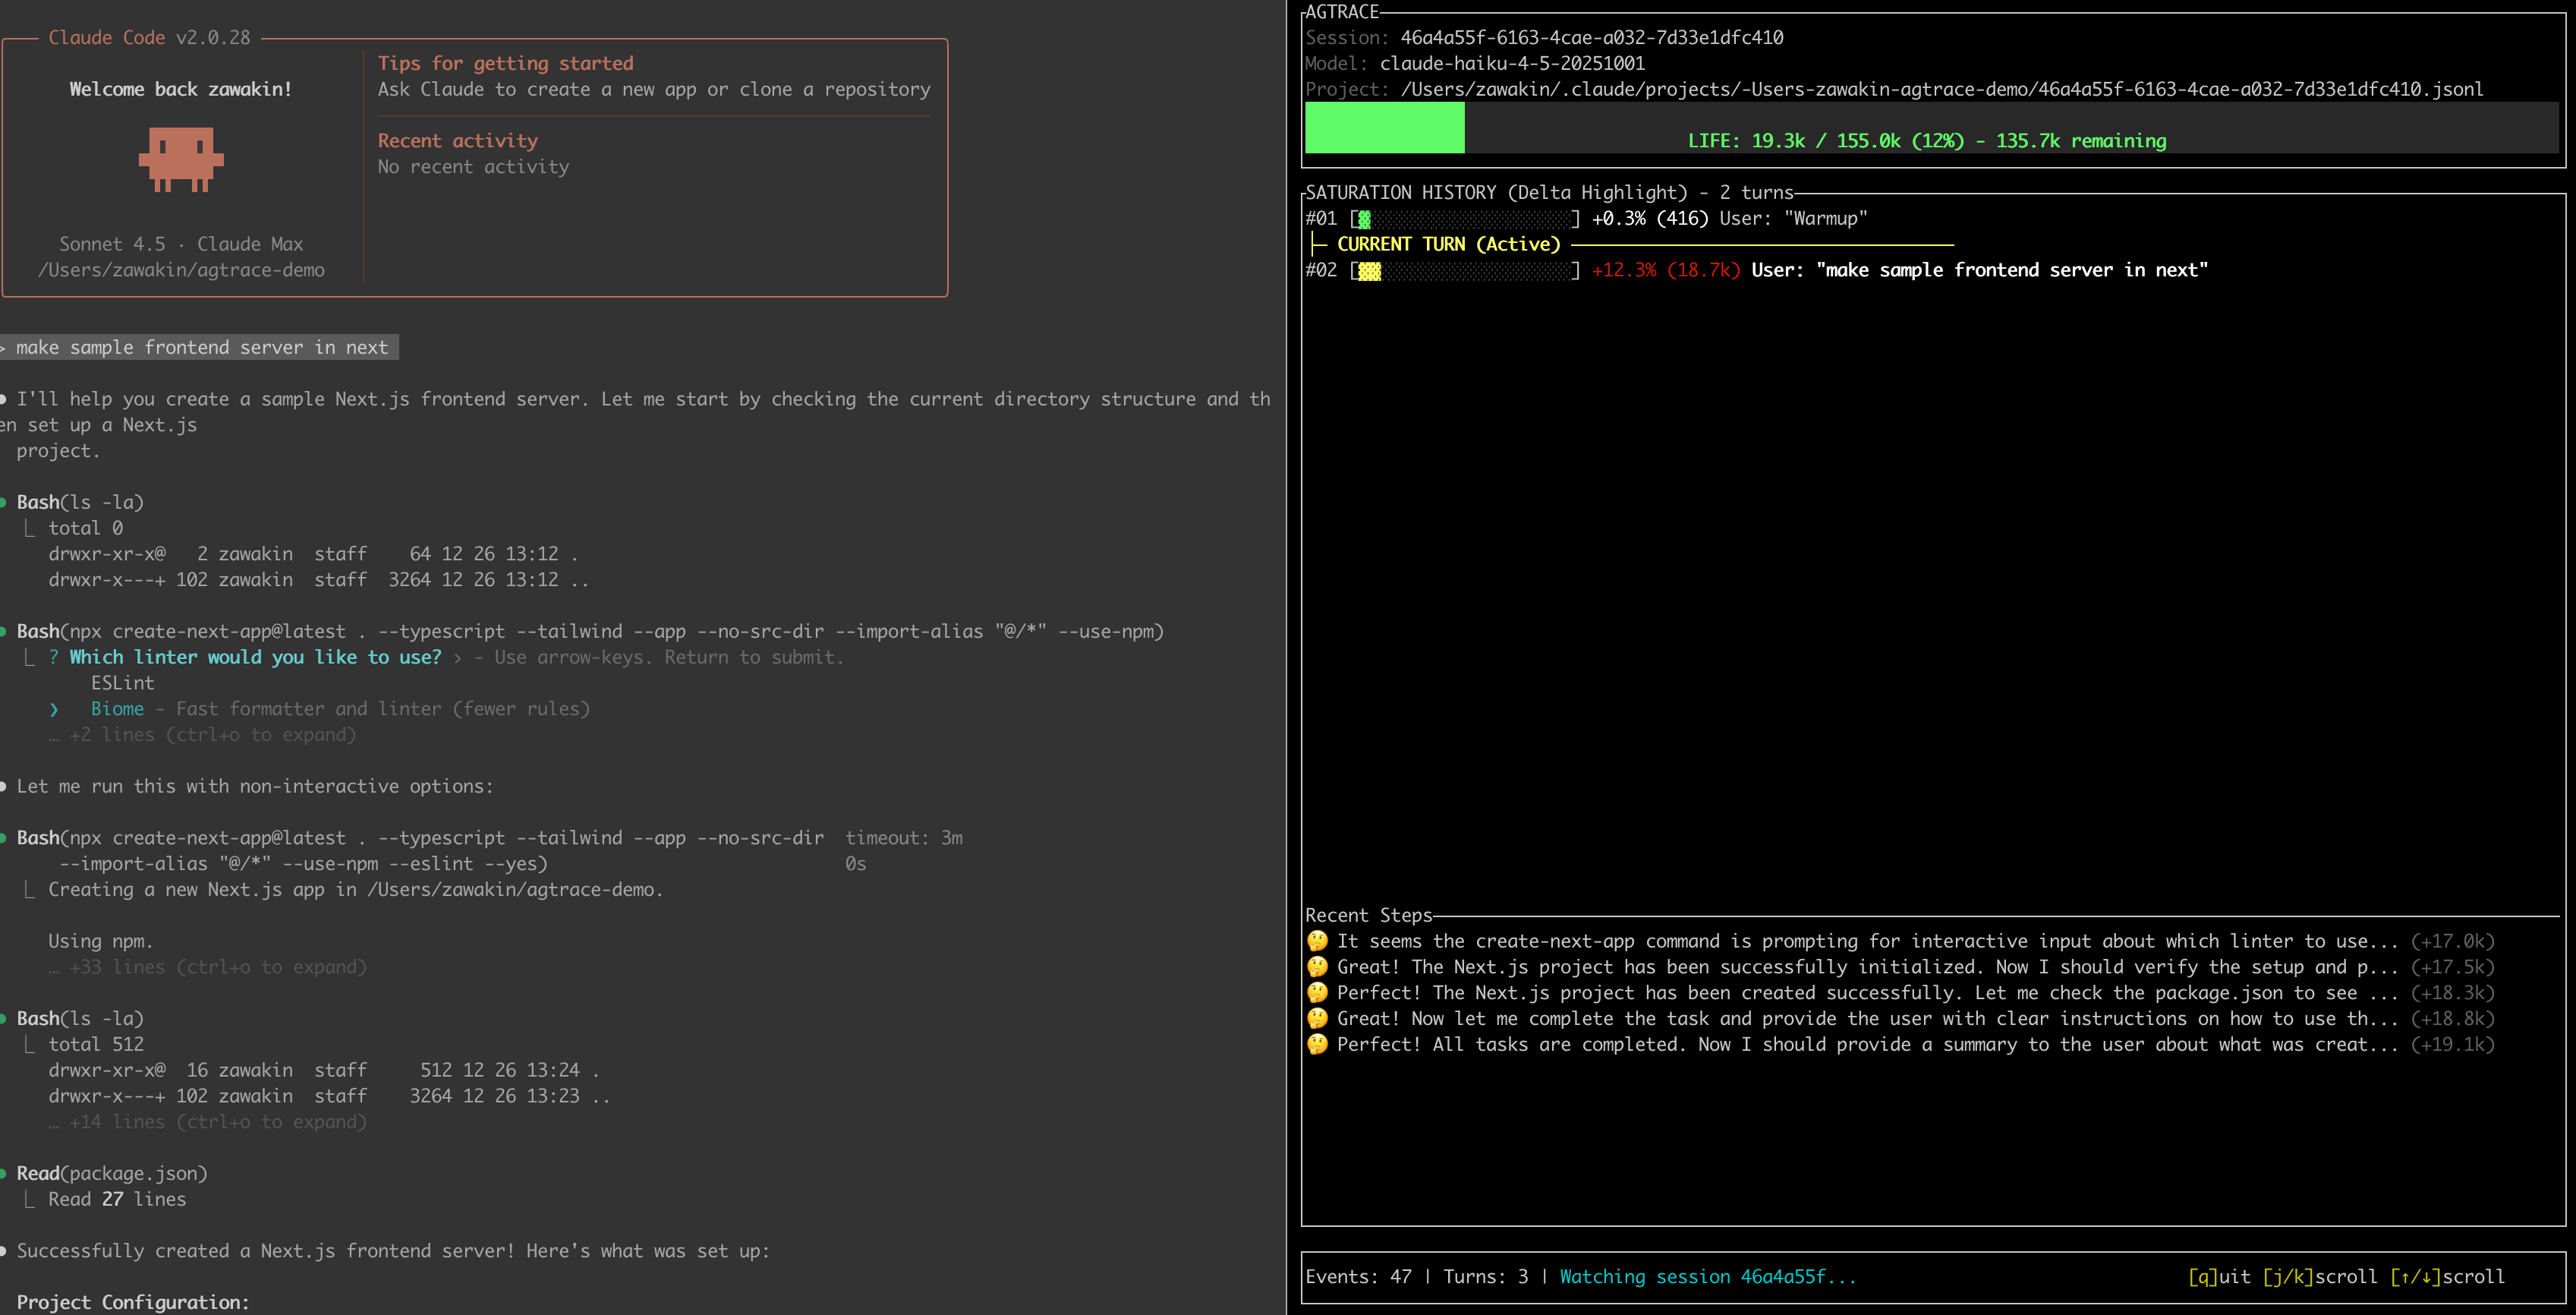
The dashboard showing context usage, current turn, and token costs
✨ Key Features
1) Live Telemetry (watch)
A TUI dashboard that visualizes the health of your active session:
- remaining context window (before compaction pressure)
- current turn and recent activity
- token/cost telemetry (where available)
2) Provider Normalization
Whether you use Claude Code, Codex, or Gemini, agtrace converts their events into a consistent internal format so you can reason about sessions the same way across providers.
3) Local-Only by Default
Agent logs often contain sensitive code and secrets. agtrace runs 100% locally and reads directly from local log files (e.g., ~/.claude). No data is sent to the cloud.
4) Always-On Session Tracking
Keep watch running — it automatically detects new sessions and follows the latest one.
5) Session Forensics (“Lab”)
Investigate agent behavior across history:
- search across thousands of past sessions
- analyze tool usage patterns
- inspect raw provider events when debugging schema changes (
--raw)
6) High-Performance, Minimal Footprint
Built in Rust, agtrace is designed to run continuously without slowing down your machine while you work with heavyweight AI agents.
7) Instant Log Analysis
Parse and grep through gigabytes of JSONL logs quickly. The schema-on-read approach plus Rust performance makes historical analysis fast and practical.
📦 Installation
For best performance and easy access to watch, install globally.
via npm (Recommended)
via npx (no installation)
If you prefer not to install globally, run via npx.
Note: In the examples below, replace agtrace with npx @lanegrid/agtrace.
via Cargo (Rust)
🚀 Quick Start
0) Initialize Once (Global)
Run agtrace init once on your machine.
This creates local configuration and caches under ~/.agtrace.
It does not modify any project directory, and you do not need to run it per project.
1) Open Your Project Directory (CWD matters)
agtrace scopes monitoring by the current working directory (cwd).
To ensure agtrace can locate and follow the right session logs, run it from the same working directory where your AI coding agent is started.
2) Start watch (either order works)
In one terminal pane (from the project directory), run:
watch can be started before or after your AI coding agent.
- If no active session exists yet, it stays in waiting mode (or opens the latest session if available).
- When a new session starts, agtrace detects the new logs and automatically switches to it.
- You do not need to restart
agtrace watchper session.
3) Start Your AI Coding Agent (Same CWD)
In another terminal (same project directory), launch your agent:
# Example: Claude Code
# Or Codex, Gemini, etc.
That’s it. No integration required — watch follows sessions by monitoring logs scoped to your current working directory.
watch surfaces:
- context window usage
- compaction pressure / behavior (where detectable)
- turns and recent activity
- token/cost telemetry (where available)
4) Analyze Past Sessions
# List recent sessions
# Inspect a specific session (context usage, turns, models)
5) Advanced: The Lab
Debug agent interactions or search for specific patterns, e.g. “When did the agent try to write to package.json?”:
# Find all file write operations across history
# Inspect a raw provider event (useful for debugging schema changes)
🧭 CWD-Scoped Monitoring
agtrace uses your current working directory (cwd) as the scope boundary for log discovery and session tracking.
To monitor a different project, run agtrace watch from that project's directory.
🏗️ Architecture
agtrace is designed around pointer-based indexing and schema-on-read:
-
No Data Duplication agtrace does not copy your massive log files. It indexes metadata and points to the original logs.
-
Resilient to Schema Drift Provider log schemas change frequently. agtrace parses logs at read time, so schema updates are less likely to corrupt or invalidate historical indexes.
-
Project Isolation Sessions are scoped by cwd/project boundaries and grouped by a project root hash to keep workspaces clean and prevent cross-project mixing.
🤝 Supported Providers
- Claude Code (Anthropic)
- Codex (OpenAI)
- Gemini (Google)
📜 License
Dual-licensed under the MIT and Apache 2.0 licenses.