# agentusage
[](https://github.com/binzhango/agentusage/actions/workflows/ci.yml)
[](https://github.com/binzhango/agentusage/releases/latest)
[](LICENSE)
**A local, open-source usage dashboard for AI coding agents.**
Agentusage turns the history already written by Codex, Claude Code, OpenCode,
and GitHub Copilot into a private usage dashboard, JSON API, terminal UI, and
CLI reports. Compare model activity over time, inspect token and cache usage,
track estimated cost, and understand which tools are consuming your AI budget.
Data stays on your machine by default. Agentusage reads provider files during
incremental synchronization and stores normalized events in SQLite. PostgreSQL
is available when you intentionally configure a shared database.
> **Project status:** early access. Provider formats change frequently, so bug
> reports, sanitized fixtures, and pull requests are especially useful.
## What you get
- An interactive browser dashboard served by a single `au server` process.
- One-click PNG downloads of individual provider cards for sharing or archiving.
- Daily token trend charts with a distinct colored line for every model.
- Today, 7-day, 30-day, and all-time views.
- Input, output, reasoning, cache-read, cache-write, and total-token metrics.
- Requests, prompts, sessions, estimated cost, code changes, and Copilot credits.
- Model, client, project, workspace, tool-call, and language breakdowns where
the provider exposes them.
- A local JSON API for scripts, integrations, and custom dashboards.
- A terminal dashboard and daily, weekly, monthly, yearly, or custom reports.
- SQLite storage by default, optional PostgreSQL, idempotent ingestion, and raw
event preservation.
- Release binaries for macOS, Linux, and Windows.
## Get started
Install both the `agentusage` command and its shorter `au` alias:
```bash
cargo install --git https://github.com/binzhango/agentusage --locked --bins
au --version
```
Synchronize the providers you use, then launch the browser dashboard:
```bash
au sync codex
au sync claude_code
au sync copilot
au server --open
```
Open [http://127.0.0.1:8787](http://127.0.0.1:8787) if the browser does not
open automatically. The default bind address is local-only; use `--host` and
`--port` when you deliberately want a different address.
Each provider has its own database. A provider that has not been synchronized
appears as unavailable and may produce a background-ingestion message such as:
```text
no initialized SQLite or PostgreSQL usage storage found;
run `agentusage sync opencode` after selecting a database backend
```
Run the suggested `au sync <provider>` command to initialize it, or ignore the
message when you do not use that provider.
## Explore usage in the browser
The built-in page is delivered directly from the Rust binary. There is no
separate frontend server, hosted account, Node.js runtime, or external chart
service to configure.

For every available provider, the page presents:
- summary cards for tokens, requests, sessions, and estimated cost;
- a daily usage chart with a highlighted total line;
- a separate colored line and legend entry for every model;
- hover details containing the model, date, and exact token count;
- a model table covering input, output, cache-read, cache-write, and total
tokens;
- a `Download PNG` action that exports the complete provider card as an image;
- responsive loading, empty, unavailable, and error states.
The range buttons switch between `Today`, `7 Days`, `30 Days`, and `All Time`.
All-time summary cards use the complete history, while the all-time trend chart
shows the latest 90 days to remain readable and quick to load.
To save a card, select the desired range and click `Download PNG` in that
provider's card. The image includes the summary metrics, usage chart, legend,
and model table shown on screen. Rendering and download happen locally in the
browser; no dashboard data is uploaded to an external image service. Files use
names such as `agentusage-codex-7d.png`.

## HTTP server and API reference
Start the server before using the page or API:
```bash
au server
```
Server options:
| `--host <HOST>` | `127.0.0.1` | Address on which the HTTP server listens |
| `--port <PORT>` | `8787` | TCP port on which the HTTP server listens |
| `--open` | disabled | Open the dashboard in the system browser after startup |
For example:
```bash
au server --host 127.0.0.1 --port 9000 --open
```
The default base URL is `http://127.0.0.1:8787`. All currently supported
routes use `GET`:
| `/` | `text/html; charset=utf-8` | Interactive browser dashboard |
| `/api/providers` | `application/json` | Provider names and storage availability |
| `/api/summary` | `application/json` | Aggregated usage for one provider and time window |
| `/api/trend` | `application/json` | Daily token totals and per-model trend data |
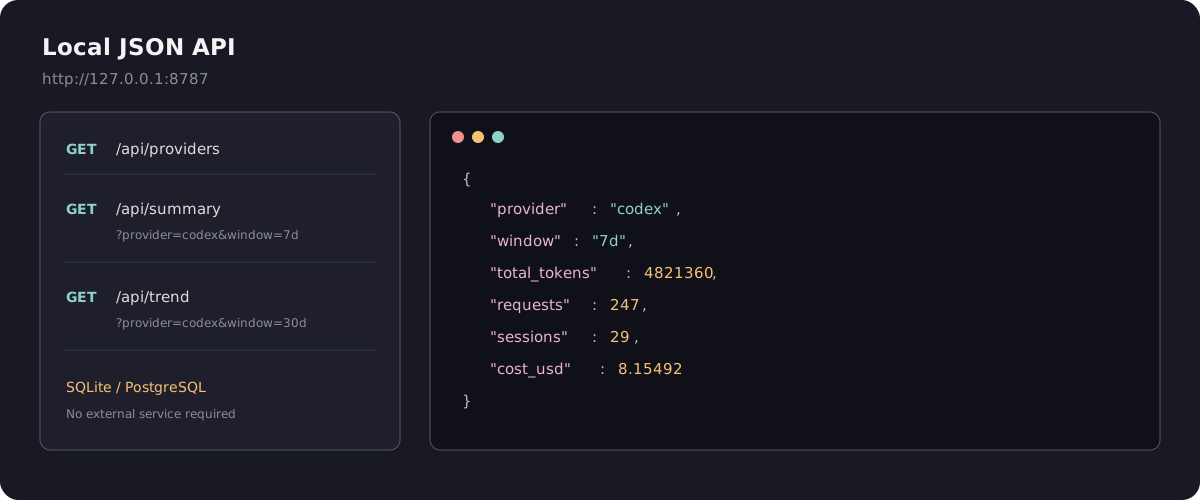
Any other path or HTTP method returns `404` with the plain-text body
`not found`.
### `GET /`
Returns the complete dashboard document. The page calls `/api/providers`, then
loads `/api/summary` and `/api/trend` for each available provider. HTML, CSS,
and JavaScript are embedded in the `au` binary, so no additional static-file
server is required.
```bash
curl 'http://127.0.0.1:8787/'
```
### `GET /api/providers`
Returns every provider known to the server. `available` is `true` when
Agentusage can open initialized SQLite or PostgreSQL storage for that provider.
It does not mean that the selected time window contains events.
This endpoint has no query parameters.
```bash
curl 'http://127.0.0.1:8787/api/providers'
```
```json
[
{ "name": "codex", "available": true },
{ "name": "claude_code", "available": true },
{ "name": "opencode", "available": false },
{ "name": "copilot", "available": true }
]
```
The provider list is currently fixed to `codex`, `claude_code`, `opencode`,
and `copilot`.
### `GET /api/summary`
Returns one aggregate usage object for a provider and time window.
| `provider` | No | `codex` | `codex`, `claude_code`, `opencode`, `copilot` |
| `window` | No | `today` | `today`, `7d`, `30d`, `all` |
Compatibility aliases are also accepted: `claude` for `claude_code`,
`open_code` for `opencode`, `7days` for `7d`, `30days` for `30d`, and
`all_time` for `all`.
```bash
curl 'http://127.0.0.1:8787/api/summary?provider=codex&window=30d'
```
The response fields are:
| `from`, `to` | RFC 3339 timestamp | Inclusive start and exclusive end of the query |
| `sessions` | integer | Distinct sessions |
| `requests`, `prompts` | integer | Request and prompt counts |
| `input_tokens`, `output_tokens` | integer | Input and generated tokens |
| `reasoning_tokens` | integer | Provider-reported reasoning tokens |
| `cache_read_tokens`, `cache_write_tokens` | integer | Prompt-cache token activity |
| `total_tokens` | integer | Total normalized token volume |
| `cost_usd` | number | Estimated or provider-reported cost in USD |
| `ai_units_nano` | integer | Provider-native AI units in nano-units |
| `request_multiplier` | number | Sum of provider request multipliers |
| `ai_credits` | number | Copilot or provider-reported AI credits |
| `lines_added`, `lines_removed` | integer | Imported code-change counts |
| `models` | object | Usage buckets keyed by model |
| `clients` | object | Usage buckets keyed by client, such as CLI or IDE |
| `projects` | object | Usage buckets keyed by project or workspace |
| `tools`, `languages` | object | Event counts keyed by tool or language |
| `primary_used_percent` | number or `null` | Latest known primary quota usage |
| `primary_window_minutes` | integer or `null` | Primary quota-window duration |
| `primary_resets_at` | integer or `null` | Provider reset timestamp when available |
Every entry in `models`, `clients`, and `projects` contains `requests`,
`input_tokens`, `output_tokens`, `reasoning_tokens`, `cache_read_tokens`,
`cache_write_tokens`, `total_tokens`, `cost_usd`, `ai_units_nano`,
`request_multiplier`, and `ai_credits`.
Example abbreviated response:
```json
{
"from": "2026-06-22T04:00:00Z",
"to": "2026-07-22T04:00:00Z",
"sessions": 18,
"requests": 246,
"prompts": 91,
"input_tokens": 315000,
"output_tokens": 42000,
"reasoning_tokens": 12000,
"cache_read_tokens": 98000,
"cache_write_tokens": 7000,
"total_tokens": 474000,
"cost_usd": 3.82,
"models": {
"gpt-5": {
"requests": 180,
"input_tokens": 250000,
"output_tokens": 35000,
"reasoning_tokens": 12000,
"cache_read_tokens": 90000,
"cache_write_tokens": 7000,
"total_tokens": 394000,
"cost_usd": 3.21,
"ai_units_nano": 0,
"request_multiplier": 0.0,
"ai_credits": 0.0
}
},
"clients": {},
"projects": {},
"tools": {},
"languages": {},
"primary_used_percent": null,
"primary_window_minutes": null,
"primary_resets_at": null
}
```
The example is abbreviated: scalar fields such as `ai_units_nano`,
`request_multiplier`, `ai_credits`, `lines_added`, and `lines_removed` are
always present in the real response.
### `GET /api/trend`
Returns an array with one point for every calendar day in the selected window,
including zero-usage days. It accepts the same `provider`, `window`, defaults,
and aliases as `/api/summary`.
```bash
curl 'http://127.0.0.1:8787/api/trend?provider=codex&window=30d'
```
Each point contains:
| `date` | `YYYY-MM-DD` string | Local calendar date represented by the point |
| `total_tokens` | integer | Total tokens for the day |
| `input_tokens` | integer | Input tokens for the day |
| `output_tokens` | integer | Output tokens for the day |
| `cache_read_tokens` | integer | Cache-read tokens for the day |
| `models` | object | Total daily tokens keyed by model name |
```json
[
{
"date": "2026-07-21",
"total_tokens": 48210,
"input_tokens": 31140,
"output_tokens": 7070,
"cache_read_tokens": 10000,
"models": {
"gpt-5": 36100,
"gpt-5-mini": 12110
}
}
]
```
For `today`, `7d`, and `30d`, the trend covers the same period as the summary.
For `all`, `/api/summary` starts at 1970-01-01 while `/api/trend` returns only
the latest 90 days to bound response size and keep the chart readable.
### Time, storage, and error behavior
- Window boundaries use the machine's local calendar and are serialized as UTC
timestamps in summary responses.
- API calls read normalized SQLite or PostgreSQL data; they do not scan provider
history files during the request.
- Background synchronization is controlled separately by `auto_sync` and
`refresh_seconds` in `config.toml`. When enabled, the server starts one
ingestion loop for each supported provider and refreshes it at that interval.
- The server binds to loopback by default and currently has no authentication or
CORS headers. Do not expose it to an untrusted network without a protective
reverse proxy.
- An unsupported window or unavailable backend is logged by the server. The
current implementation does not yet return a structured JSON error body for
these failures.
## Other ways to view usage
For an interactive terminal UI:
```bash
au dashboard
```
Use `w` to cycle through time windows, `r` to refresh, and `q` to quit. The
terminal dashboard requires an interactive terminal.

## Installation options
For a local checkout, run `cargo install --path . --locked --bins`. You can
also download a prebuilt archive from the
[latest GitHub release](https://github.com/binzhango/agentusage/releases/latest).
| macOS Apple Silicon | `agentusage-macos-aarch64.tar.gz` |
| Linux ARM64 | `agentusage-linux-aarch64.tar.gz` |
| Linux x86_64 | `agentusage-linux-x86_64.tar.gz` |
| Windows x86_64 | `agentusage-windows-x86_64.zip` |
Release archives include `SHA256SUMS`. They contain both `agentusage` and `au`;
the two binaries support the same dashboard, server, report, and telemetry
commands.
## How it works
```mermaid
flowchart LR
Sources[Codex / Claude Code / OpenCode / Copilot] --> Sync[Incremental sync]
Hooks[Telemetry hooks] --> Normalize[Normalize + deduplicate]
Sync --> Normalize
Normalize --> SQLite[(SQLite)]
Normalize --> PostgreSQL[(PostgreSQL)]
SQLite --> Reports[CLI reports]
SQLite --> TUI[Terminal dashboard]
SQLite --> Server[Local API + browser dashboard]
PostgreSQL --> Reports
PostgreSQL --> TUI
PostgreSQL --> Server
```
Provider files are only read during synchronization. Reports, dashboards, and
API endpoints query the normalized database. The browser presentation lives in
`src/view.rs`; HTTP routing and trend aggregation live in `src/server.rs`.
## Reports
Detailed reports are available directly through the period commands. All report
commands accept `--provider`.
```bash
# Today
agentusage daily --provider codex
agentusage daily --provider claude_code
agentusage daily --provider opencode
agentusage daily --provider copilot
# Specific date
agentusage daily --provider codex --date 2026-07-19
# Week, month, and year
agentusage weekly --provider codex
agentusage monthly --provider copilot --month 2026-07
agentusage yearly --provider claude_code --year 2026
# Inclusive date range
agentusage range --provider copilot \
--from 2026-07-01 --to 2026-07-19
```
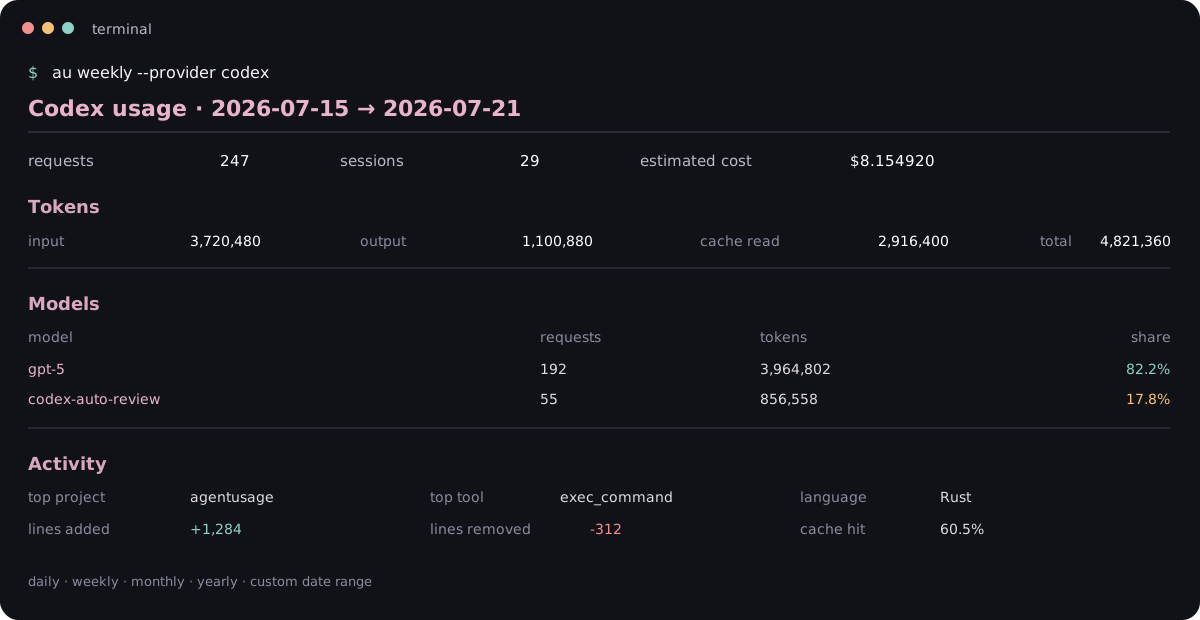
Reports include:
- requests, prompts, sessions, lines added, and lines removed;
- input, output, reasoning, cache-read, cache-write, and total tokens;
- estimated cost and cache-hit rate when pricing data is available;
- model and client breakdowns;
- project/workspace breakdowns when provider metadata includes a working directory;
- tool-call and language breakdowns for imported provider telemetry;
- Copilot AI credits and native AI-unit values when the source provides them.
Provider files can be imported from an alternate source directory during an
explicit synchronization:
```bash
agentusage sync codex --sessions-dir /path/to/codex/sessions
```
The provider is a positional argument for readability. The compatibility forms
`agentusage sync --provider codex` and `agentusage ingest --provider codex` are
also supported.
## Supported providers
| `codex` | Codex rollout JSONL | Tokens, models, cache, cost, sessions, and code changes |
| `claude_code` | Claude Code session JSONL | Tokens, models, and sessions |
| `opencode` | OpenCode session JSONL | Tokens, models, sessions, and cost fields |
| `copilot` | Copilot CLI databases and VS Code chat JSONL/logs | CLI/IDE attribution, tokens, models, and AI credits |
For VS Code Copilot, an entry such as `MAI-Code-1-Flash • 1.6 credits` is
reported with its resolved model and exact `copilotCredits` value when that
metadata is present locally.
## Storage and configuration
Provider reports use separate SQLite databases by default. Commands, the
dashboard, and the server read metrics and status only from these tables; local
provider files are read only by ingestion:
```text
~/.local/state/agentusage/codex.db
~/.local/state/agentusage/claude_code.db
~/.local/state/agentusage/opencode.db
~/.local/state/agentusage/copilot.db
```
Telemetry hooks and the daemon use:
```text
~/.local/state/agentusage/telemetry.db
```
Set `XDG_STATE_HOME` to change the state directory:
```bash
XDG_STATE_HOME="$HOME/.local/state" agentusage daily --provider codex
```
## Automatic synchronization
Automatic sync is configured in `~/.config/agentusage/config.toml` (or the path
set by `AGENTUSAGE_CONFIG`):
```toml
[sync]
auto_sync = true
refresh_seconds = 300
```
The dashboard and server ingest provider files at this interval. Report
commands perform one incremental sync before querying the database, and the
provider hook performs the same sync after an agent event. Set
`refresh_seconds` to the interval you prefer.
PostgreSQL is available through `AGENTUSAGE_POSTGRES_URL`. When no initialized
provider SQLite database exists, the first-run prompt can select PostgreSQL:
```bash
export AGENTUSAGE_POSTGRES_URL='postgresql://user:password@localhost/agentusage'
agentusage monthly --provider copilot
```
The project does not use an `OPENUSAGE_*` database variable.
## Telemetry hooks and daemon
Pass a hook payload positionally:
```bash
agentusage telemetry hook codex \
'{"turn_id":"turn-1","usage":{"input_tokens":10,"output_tokens":4}}' \
--verbose
```
Or pipe the payload through stdin:
```bash
printf '%s' '{"event":"message","usage":{"input_tokens":10}}' \
| agentusage telemetry hook claude_code --verbose
```
Supported hook sources are `codex`, `claude_code`, and `opencode`. Useful
options include:
- `--account-id` to preserve an account dimension;
- `--db-path` to use a custom telemetry database;
- `--spool-only` to write to the local spool without immediate ingestion;
- `--verbose` to print the event and deduplication result.
When a hook is configured for a provider, the non-spool hook path also runs an
incremental provider-file sync into that provider's database. Reports perform
the same sync before querying, so the database remains the only read path for
metrics and status.
Start the daemon with the default or a custom database:
```bash
agentusage telemetry daemon
agentusage telemetry daemon --db-path /path/to/telemetry.db
```
## Command reference
```text
agentusage --help
agentusage dashboard --help
agentusage server --help
agentusage daily --help
agentusage weekly --help
agentusage monthly --help
agentusage yearly --help
agentusage range --help
agentusage telemetry --help
```
Running `agentusage` without a subcommand prints this help. Use
`agentusage dashboard` for the terminal UI and `agentusage server` for the
browser UI.
## Privacy and data safety
`agentusage` is designed to operate locally. It reads provider files and
stores normalized events in local databases; it does not require a hosted
account or send usage data to a project-controlled service. Treat local usage
databases, raw events, and PostgreSQL credentials as sensitive data.
## Development
Contributor checks are documented in
[docs/DEVELOPMENT.md](docs/DEVELOPMENT.md). Automatic versioning, crates.io
publishing, platform builds, and GitHub releases are documented in
[docs/RELEASING.md](docs/RELEASING.md).
Release history is maintained in [CHANGELOG.md](CHANGELOG.md).
The Rust source is rooted in this repository. The local reference checkout is
excluded from Rust packages, GitHub Actions, and release archives.
## Contributing
Bug reports and pull requests are welcome. When adding or changing a provider:
1. Include a sanitized fixture or regression test when possible.
2. Preserve idempotent ingestion and backward-compatible storage behavior.
3. Run the checks in [docs/DEVELOPMENT.md](docs/DEVELOPMENT.md).
4. Do not commit provider credentials, raw private transcripts, or local
databases.
## License
`agentusage` is available under the [MIT License](LICENSE).