Expand description
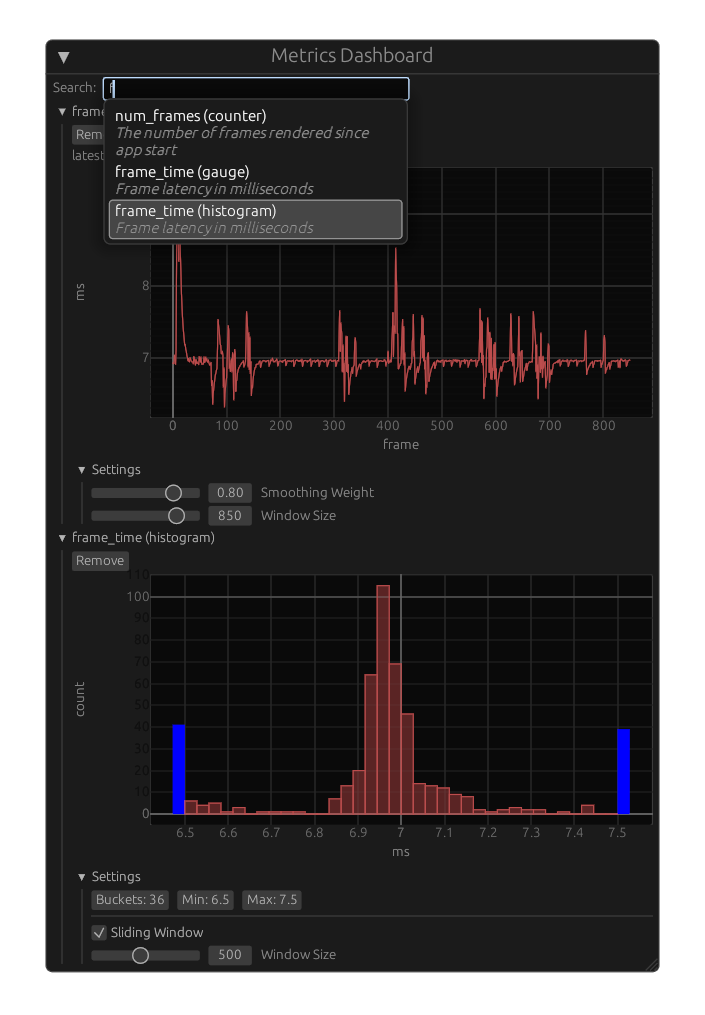
A metrics dashboard for Bevy.
This library enables Bevy apps to search and plot any metrics defined by
the metrics crate within the app itself.
§Should I use this?
This library is not a replacement for tools that export metrics into a monitoring service with a time series database, nor does it reject that methodology. This library is a supplemental tool that allows users to cheaply plot high-resolution metrics in real time within the app that defines them. As such, this tool shines when you are debugging an issue that is reproducible and requires real-time feedback or ad-hoc instrumentation.
§How does it work?
The metrics crate lets developers define metrics in their code using simple
macros. Each process has a global registry (AKA “recorder”) of all of the
metrics that have been used or described in code.
The provided Bevy plugin defines and installs a registry, and the dashboard widget lets users search the registry and plot metrics.
§Getting Started
See the “examples” directory.
Steps for plotting your metrics:
- Define metrics using the
metricscrate. - Add the
bevy_egui::EguiPlugin,RegistryPlugin, andDashboardPluginto your app. You may need to enable thebevy_eguifeature. - Spawn an entity with the
DashboardWindowcomponent.
§Low-Level API
You can build your own metrics dashboard widgets by reusing building blocks like
the search bar and plot widgets. Read the source code of DashboardWindow to
see how it works.
§Version Support
| bevy_metrics_dashboard | bevy | egui | bevy_egui |
|---|---|---|---|
| 0.8 | 0.16 | 0.32 | 0.36 |
| 0.7 | 0.16 | 0.31 | 0.34 |
| 0.6 | 0.15 | 0.31 | 0.33 |
| 0.5 | 0.15 | 0.31 + 0.30 | 0.32 |
| 0.4 | 0.15 | 0.30 | 0.32 |
| 0.3 | 0.14 | 0.31 + 0.29 | 0.30 |
Re-exports§
pub use egui;pub use egui_plot;pub use metrics;pub use metrics_util;
Modules§
Structs§
- Cached
Plot Configs - Cache of configs for plots that have been opened and removed.
- Clear
Buckets System - The
SystemSetfrom which atomic buckets are cleared. - Core
Metrics Plugin - Provides core metrics like frame time, entity count, etc.
- Dashboard
Config - Configuration for a single
DashboardWindow. - Dashboard
Window - An
eguiwindow that can search for metrics and plot them. - Namespace
Tree Window - A widget that shows all metrics metadata in a tree, grouped by namespace.
- Registry
Plugin - Installs and garbage collects a
MetricsRegistry. - Request
Plot - Event used to create a new plot in all
DashboardWindowentities. - Search
Bar - A widget that searches the
MetricsRegistrywith fuzzy string matching.