Expand description
§termplot
An extensible plotting library for CLI applications.
§Quick start
To use termplot, add the crate to your Cargo.toml.
[dependencies]
termplot = "0.1.0"
Plot is the entry point of the library. Start by creating a Plot and play with it!
§Examples
§Plotting a function
Here is a quick example of what plotting sin(x) / x looks like.
use termplot::*;

let mut plot = Plot::default();
plot.set_domain(Domain(-10.0..10.0))
    .set_codomain(Domain(-0.3..1.2))
    .set_title("Graph title")
    .set_x_label("X axis")
    .set_y_label("Y axis")
    .set_size(Size::new(50, 25))
    .add_plot(Box::new(plot::Graph::new(|x| x.sin() / x)));

println!("{plot}");
Output of the previous example:
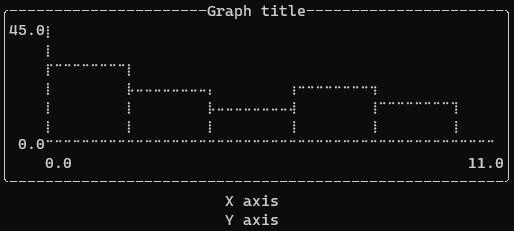
§Histogram
use termplot::*;
use rand::Rng;

let mut rng = rand::thread_rng();
let values: Vec<f64> = (0..100).map(|_| rng.gen_range(0.0f64..10.0f64)).collect();

let mut plot = Plot::default();

plot.set_domain(Domain(0.0..11.0))
    .set_codomain(Domain(0.0..45.0))
    .set_title("Graph title")
    .set_x_label("X axis")
    .set_y_label("Y axis")
    .set_size(Size::new(50, 25))
    .add_plot(Box::new(plot::Histogram::new(
        values,
        vec![0.0..2.0, 2.0..4.0, 4.0..6.0, 6.0..8.0, 8.0..10.0], // buckets
    )));

println!("{plot}");
Output of the previous example:
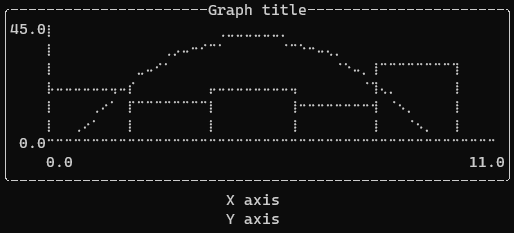
§Composing multiple plots
It is also possible to compose multiple plots together:
use termplot::*;
use rand::Rng;

let mut rng = rand::thread_rng();
let values: Vec<f64> = (0..100).map(|_| rng.gen_range(0.0f64..10.0f64)).collect();

let mut plot = Plot::default();

plot.set_domain(Domain(0.0..11.0))
    .set_codomain(Domain(0.0..45.0))
    .set_title("Graph title")
    .set_x_label("X axis")
    .set_y_label("Y axis")
    .set_size(Size::new(50, 25))
    .add_plot(Box::new(plot::Histogram::new(
        values,
        vec![0.0..2.0, 2.0..4.0, 4.0..6.0, 6.0..8.0, 8.0..10.0],
    )))
    .add_plot(Box::new(plot::Graph::new(|x| {
        -2.0 * (x - 5.0).powf(2.0) + 40.0
    })));

println!("{plot}");
Output of the previous example:
Modules§
- plot
- Different types of plots and graphs that can be plotted or graphed onto the view.
Structs§
- Domain
- Domain or codomain of a graph.
- Domain
Iterator - An iterator over the domain with a number of steps.
- Plot
- A container used for adding plots.
- Size
- A size.
- View
- A
Viewis where the graph and plots are drawn. The view does not includes decorations around the plot (labels, title, border, etc..). - View
Canvas - The view where graphs are graphed and plots are plotted.
Traits§
- Draw
View - A drawable component on the view.