Expand description
Save data and have a glance at it with quick plots. Leave the detailed plotting to other interactive tools like gnuplot.
Do you have a costly process in Rust and want to save the data for postprocessing? Would you like to still have a basic glance to check it and leave fine-tuning of the plot for later? This is the crate for you!
§Philosophy
Rust is great at computing, making the perfect plot takes times and repetition. This repetitive process in search of the perfect plot should be done externally, and does not need Rust computing power. Therefore, once you achieve the data in Rust, save it, have a quick glance, and leave a simple gnuplot-script to start the fine tunning of your perfect plot.
§Remarks
All data will be saved under the folder “target\preexplorer\data” in the main directory. Plot scripts are saved under the foleder “target\preexplorer\plots”.
Recall that you will need to install gnuplot to use the crate at its full potential.
§Examples
Quickly check your results.
use preexplorer::prelude::*;
(0..100).map(|i| i * i)
    .preexplore()
    .set_title("My computations")
    .plot("my_identifier")
    .unwrap();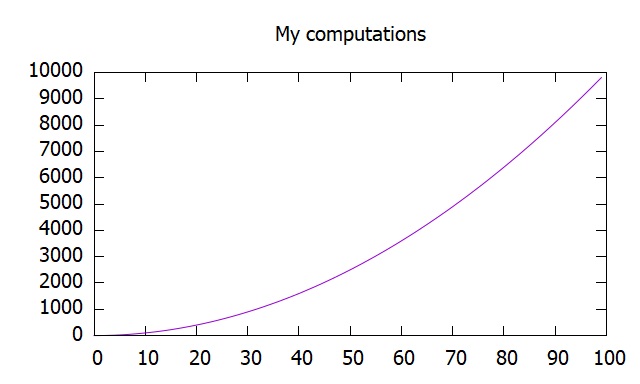
Check numerical simulations.
use preexplorer::prelude::*;
use rand_distr::Exp1;
use rand::prelude::*;
let simulation_results: Vec<f64> = (0..100).map(|_| thread_rng().sample(Exp1)).collect();
pre::Density::new(simulation_results)
    .set_title("Empirical Exponential 1")
    .plot("my_identifier")
    .unwrap();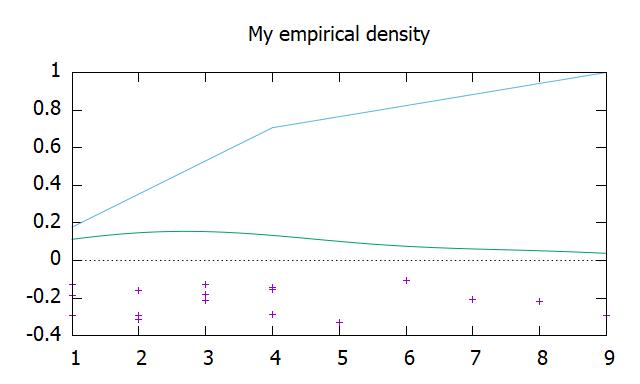
Save some data (mostly numerical: matrices, simulation results and related errors, etc).
use preexplorer::prelude::*;
let my_data = vec![0., 1.1, 0.001, 2., 2.3, 0.01, 3., 1.7, 0.02]; // Some data
let dimension = 2;
pre::Data::new(my_data, dimension)
    .set_title("My title")
    .plot_later("my_identifier")
    .unwrap();
Plot some function in a grid.
use preexplorer::prelude::*;
use ndarray::Array;
let grid = Array::linspace(0., 1., 20);
let values = grid.iter().map(|x| x * x);
(grid.iter(), values).preexplore()
    .set_title("My title")
    .plot("my_identifier")
    .unwrap();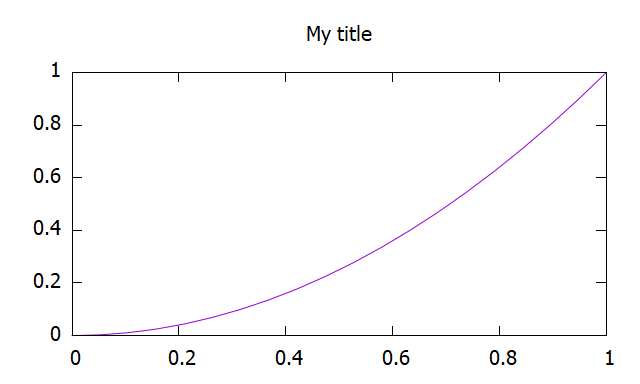
Check out the gallery for more.
§Optional features
use-serde— Enables serde support.
Re-exports§
pub use self::traits::*;
Modules§
- errors
- Errors wrapper from writting data.
- prelude
- All you ussually need. Easily start preexploring you results.
- traits
- Traits for easy use or self implmentation.
Structs§
- Configuration
- Configuration for all basic options included.
- Contour
- 3-dimensional surface by plotting constant z slices, called contours, on a 2-dimensional format.
- Data
- Generic multi-dimensional data.
- Densities
- Comparison counter part of Density struct.
- Density
- A type to a histogram: point cloud, probability density, cummulative probability distribution and/or bins.
- Heatmap
- Indexed sequence of values.
- Heatmaps
- Comparison counter part of Heatmap struct.
- Process
- Indexed sequence of values.
- Process
Bin - Indexed collection of histograms.
- Process
Bins - Comparison counter part of ProcessBin struct.
- Process
Error - Indexed collection of values with a given error.
- Process
Errors - Comparison counter part of ProcessError struct.
- Process
Violin - Indexed collection of histograms, which will be represented as violins.
- Process
Violins - Comparison counter part of ProcessViolin struct.
- Processes
- Comparison counter part of Process struct.
- Sequence
- Most basic explorable structure: a sequence of values.
- Sequence
Bin - Sequence of histograms normalize to represent a probability density function through bins.
- Sequence
Bins - Comparison counter part of SequenceBin struct.
- Sequence
Error - Sequence of values with a given error.
- Sequence
Errors - Comparison counter part of SequenceError struct.
- Sequence
Violin - Sequence of violin plots.
- Sequence
Violins - Comparison counter part of SequenceViolin struct.
- Sequences
- Comparison counter part of Sequence struct.
Enums§
- Style
- A small collection of all possible styles.
Constants§
Functions§
- clean
- Removes generated artifacts