[−][src]Module peroxide::util::plot
Plotting module for peroxide
For Rust, there are some plot libraries but, still difficult to use. Practically, using python is best choice to plot. And there is awesome crate - pyo3.
Let's see next ordinary code file.
extern crate peroxide;
use peroxide::*;

fn main() {
    let init_state = State::<f64>::new(0f64, c!(1), c!(0));

    let mut ode_solver = ExplicitODE::new(test_fn);

    ode_solver
        .set_method(ExMethod::RK4)
        .set_initial_condition(init_state)
        .set_step_size(0.01)
        .set_times(1000);

    let result = ode_solver.integrate();

    let mut st = SimpleWriter::new();
    st.set_path("example_data/rk4_test.pickle")
        .insert_matrix(result)
        .write_pickle();
}

fn test_fn(st: &mut State<f64>) {
    let x = st.param;
    let y = &st.value;
    let dy = &mut st.deriv;
    dy[0] = (5f64*x.powi(2) - y[0]) / (x + y[0]).exp();
}
Now, let's modify this code to below. Then it works surprisingly!
extern crate peroxide;
use peroxide::*;

fn main() {
    let init_state = State::<f64>::new(0f64, c!(1), c!(0));

    let mut ode_solver = ExplicitODE::new(test_fn);

    ode_solver
        .set_method(ExMethod::RK4)
        .set_initial_condition(init_state)
        .set_step_size(0.01)
        .set_times(1000);

    let result = ode_solver.integrate();

    let x = result.col(0);
    let y = result.col(1);

    let mut plt = Plot2D::new();
    plt.set_domain(x)
        .insert_image(y)
        .set_title("Test Figure")
        .set_fig_size((10, 6))
        .set_dpi(300)
        .set_legends(vec!["RK4"])
        .set_path("example_data/test_plot.png");

    plt.savefig();
}

fn test_fn(st: &mut State<f64>) {
    let x = st.param;
    let y = &st.value;
    let dy = &mut st.deriv;
    dy[0] = (5f64 * x.powi(2) - y[0]) / (x + y[0]).exp();
}
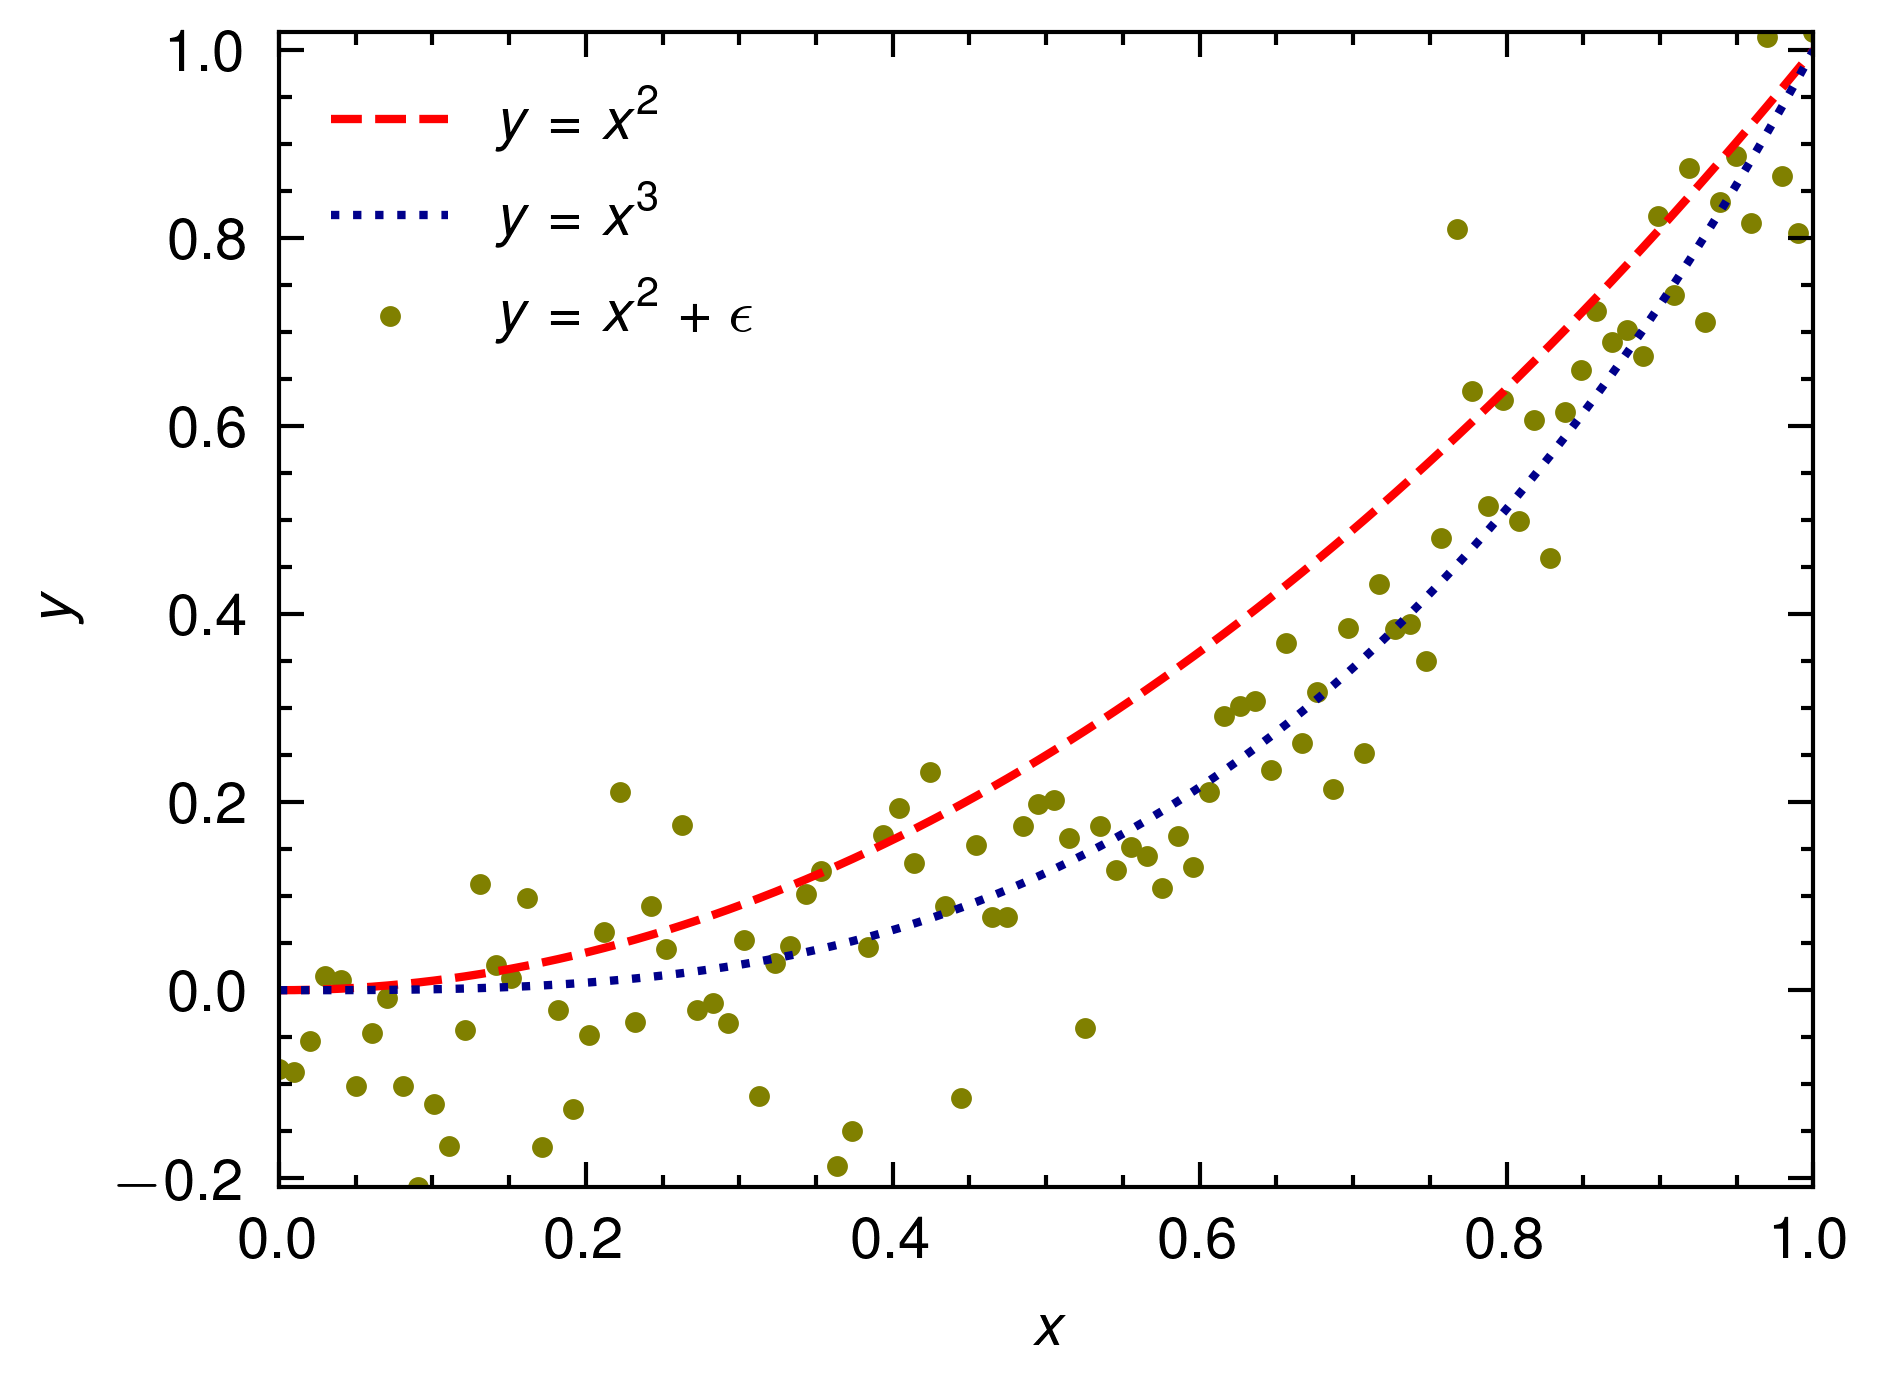
It draws next image
Re-exports
pub use Grid::*; |
Structs
| Plot2D |
Enums
| Grid | |
| PlotOptions |
Traits
| Plot |