Expand description
This is an experimental library for DSP in Rust, including for no-std environments.
It uses trait implementation from the mixed_num crate to enable both fixed point and floating point support.
Most of the functionality in this library is no-std, but requires alloc.
The STD feature can be used to unlock plotting functionality, e.g. for testing purposes.
§Example
use ndsp::*;

let signalf32 = Vec::lin_range(0f32, 9f32, 10);
let signalf64 = Vec::lin_range(2f64, 11f64, 10);

let result = signalf32.clone()*signalf64;
assert_eq!(result.to_string(), "[ 0, 3, 8, 15, 24, 35, 48, 63, 80, 99 ]" );

let signal1f32 = Vec::lin_range(2f64, 11f64, 10);

let result = signalf32*signal1f32;
assert_eq!(result.to_string(), "[ 0, 3, 8, 15, 24, 35, 48, 63, 80, 99 ]" );
This implementation simulataneously support complex numbers.
§Example
use ndsp::*;
use mixed_num::*;

let omega = <f32>::mixed_pi()/f32::mixed_from_num(8i32);
let theta = 0f32;

let mut signal = Vec::osc(omega, theta, 4);
signal = &signal*&signal;
assert_eq!(signal.to_string(), "[ 1+0i, 0.7071067+0.7071068i, 0+0.99999994i, -0.7071067+0.7071068i ]" );

signal /= 2f32;
assert_eq!(signal.to_string(), "[ 0.25-0.25i, 0.35355338+0.000000029802322i, 0.24999999+0.24999999i, 0.000000029802322+0.35355338i ]" )§Plotting
The package contains utility funcitons that simplify plotting of data.
§Plot Example
use ndsp::*;
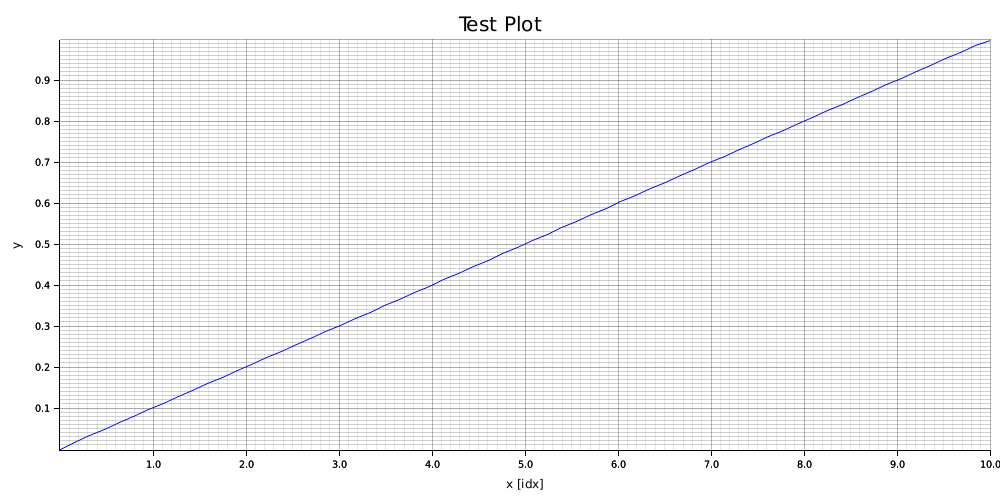
let test_vec = Vec::lin_range(0f32, 1f32, 64);
test_vec.simple_plot("./figures/plot_test.png", "Test Plot");
The resulting plot is shown below.

use ndsp::*;
use mixed_num::*;

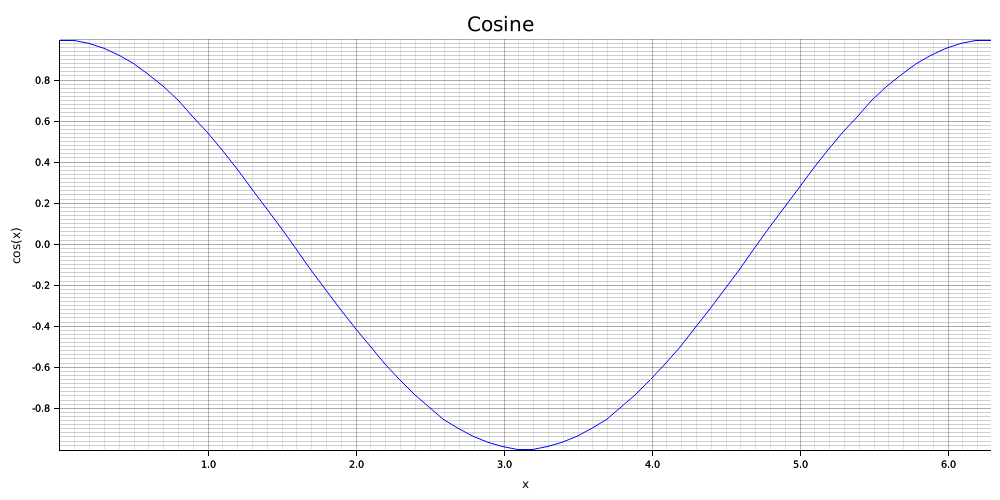
let x_vec = Vec::lin_range(0f32, f32::mixed_tau(), 64);
let mut y_vec = x_vec.clone();

y_vec.cos();

x_vec.plot(&y_vec, "./figures/lib_plot_x_y.png", "Cosine", "x", "cos(x)");
§Window functions
The package support selected window funcitons.
use ndsp::*;
use mixed_num::Cartesian;

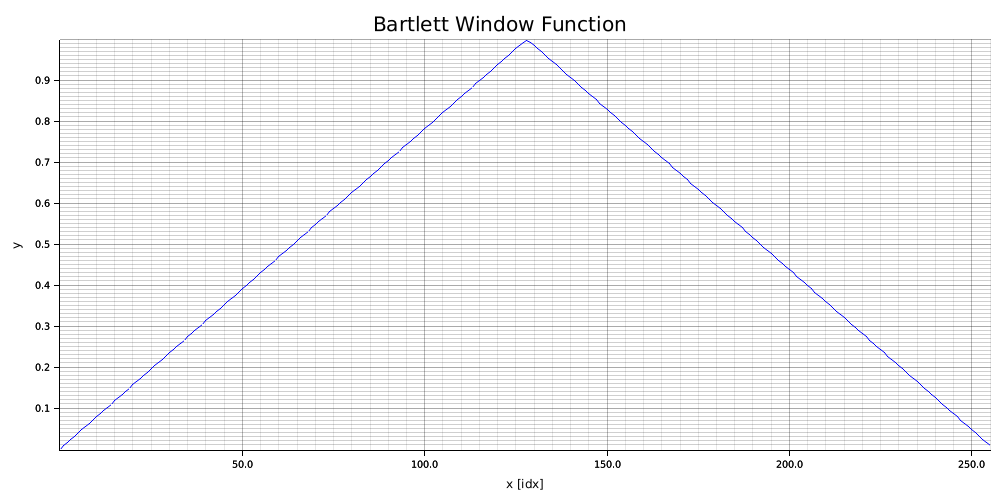
let mut vec = Vec::<f32>::bartlett(256);

vec.simple_plot("./figures/bartlett_test_lib.png", "Bartlett Window Function");

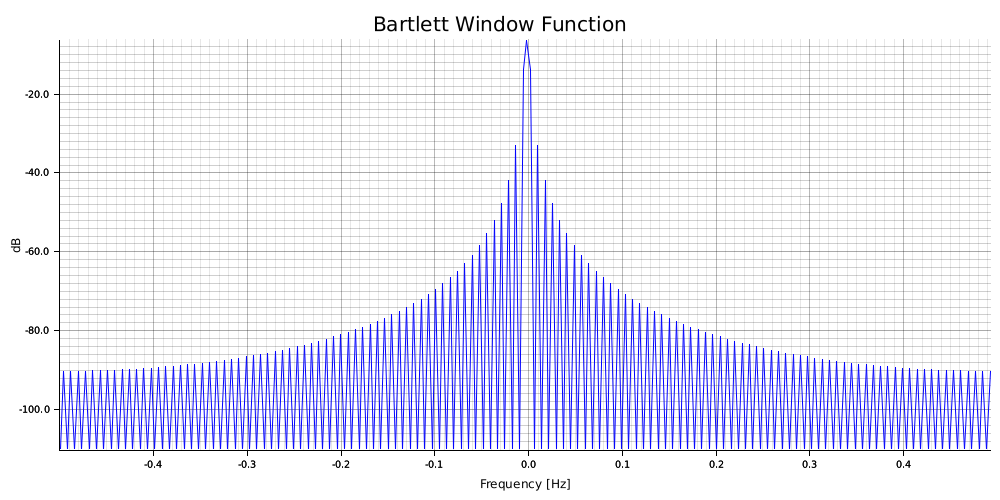
let c_vec = Vec::<Cartesian<f32>>::new_from_real(vec);
c_vec.plot_psd( 1f32, -110f32, "./figures/bartlett_psd_test_lib.png", "Bartlett Window Function" );
The resulitg plots are shown below.

