Expand description
§Ferrischart: Build informative graphs in Rust
Ferrischart is a tool to build informative graphs in Rust. ferrischart is built entirely from the ground up completely in Rust! It aims to interface will Rust data types as well as the polars crate.
§Quickstart: Quickly building a Scatter Graph
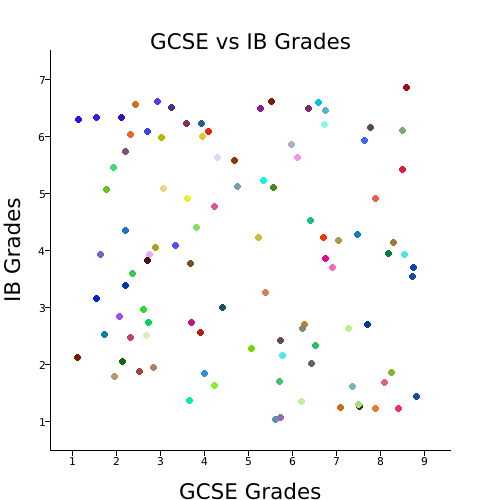
To showcase how easy it is to use ferrischart, we’ll build a scatter graph, comparing what grades students achieved in an exam conducted when they’re 15/16 (GCSE) and an exam, conducted when they’re 17/18 (IB).
use ferrischart::{error::ChartResult, charts::scatter::ScatterGraph};

// first we'll generate some random data for this example
let mut data = vec![];
let mut rng = rand::thread_rng();
for _ in 0..100 {
    let x = rng.gen_range(1.0..9.0);
    let y = rng.gen_range(1.0..7.0);
    data.push((x, y));
}

// now we'll actually build the graph
ScatterGraph::build()
    .set_title("GCSE vs IB Grades") // set a title for your graph
    .set_axis_text("GCSE Grades", "IB Grades") // set some text describing each axis
    .load_data(data) // load data
    .draw("cool-graph.png")?; // draw and save your graph
The following code should generate a graph that looks something like this (keep in mind, your data positions may differ)