# pprof
`pprof` is a cpu profiler that can be easily integrated into a rust program.
[](https://crates.io/crates/pprof)
## Usage
First, get a guard to start profiling. Profiling will continue until this guard was dropped.
```rust
let guard = pprof::ProfilerGuard::new(100).unwrap();
```
During the profiling time, you can get a report with the guard.
```rust
if let Ok(report) = guard.report().build() {
println!("report: {}", &report);
};
```
`Display` was implemented for `Report`. It will print a human-readable stack counter report. Here is an example:
```
FRAME: backtrace::backtrace::trace::h3e91a3123a3049a5 -> FRAME: pprof::profiler::perf_signal_handler::h7b995c4ab2e66493 -> FRAME: Unknown -> FRAME: prime_number::is_prime_number::h70653a2633b88023 -> FRAME: prime_number::main::h47f1058543990c8b -> FRAME: std::rt::lang_start::{{closure}}::h4262e250f8024b06 -> FRAME: std::rt::lang_start_internal::{{closure}}::h812f70926ebbddd0 -> std::panicking::try::do_call::h3210e2ce6a68897b -> FRAME: __rust_maybe_catch_panic -> FRAME: std::panicking::try::h28c2e2ec1c3871ce -> std::panic::catch_unwind::h05e542185e35aabf -> std::rt::lang_start_internal::hd7efcfd33686f472 -> FRAME: main -> FRAME: __libc_start_main -> FRAME: _start -> FRAME: Unknown -> THREAD: prime_number 1217
FRAME: backtrace::backtrace::trace::h3e91a3123a3049a5 -> FRAME: pprof::profiler::perf_signal_handler::h7b995c4ab2e66493 -> FRAME: Unknown -> FRAME: alloc::alloc::box_free::h82cea48ed688e081 -> FRAME: prime_number::main::h47f1058543990c8b -> FRAME: std::rt::lang_start::{{closure}}::h4262e250f8024b06 -> FRAME: std::rt::lang_start_internal::{{closure}}::h812f70926ebbddd0 -> std::panicking::try::do_call::h3210e2ce6a68897b -> FRAME: __rust_maybe_catch_panic -> FRAME: std::panicking::try::h28c2e2ec1c3871ce -> std::panic::catch_unwind::h05e542185e35aabf -> std::rt::lang_start_internal::hd7efcfd33686f472 -> FRAME: main -> FRAME: __libc_start_main -> FRAME: _start -> FRAME: Unknown -> THREAD: prime_number 1
FRAME: backtrace::backtrace::trace::h3e91a3123a3049a5 -> FRAME: pprof::profiler::perf_signal_handler::h7b995c4ab2e66493 -> FRAME: Unknown -> FRAME: prime_number::main::h47f1058543990c8b -> FRAME: std::rt::lang_start::{{closure}}::h4262e250f8024b06 -> FRAME: std::rt::lang_start_internal::{{closure}}::h812f70926ebbddd0 -> std::panicking::try::do_call::h3210e2ce6a68897b -> FRAME: __rust_maybe_catch_panic -> FRAME: std::panicking::try::h28c2e2ec1c3871ce -> std::panic::catch_unwind::h05e542185e35aabf -> std::rt::lang_start_internal::hd7efcfd33686f472 -> FRAME: main -> FRAME: __libc_start_main -> FRAME: _start -> FRAME: Unknown -> THREAD: prime_number 1
```
## Flamegraph
```toml
pprof = { version = "0.3", features = ["flamegraph"] }
```
If `flamegraph` feature is enabled, you can generate flamegraph from the report. `Report` struct has a method `flamegraph` which can generate flamegraph and write it into a `Write`.
```rust
if let Ok(report) = guard.report().build() {
let file = File::create("flamegraph.svg").unwrap();
report.flamegraph(file).unwrap();
};
```
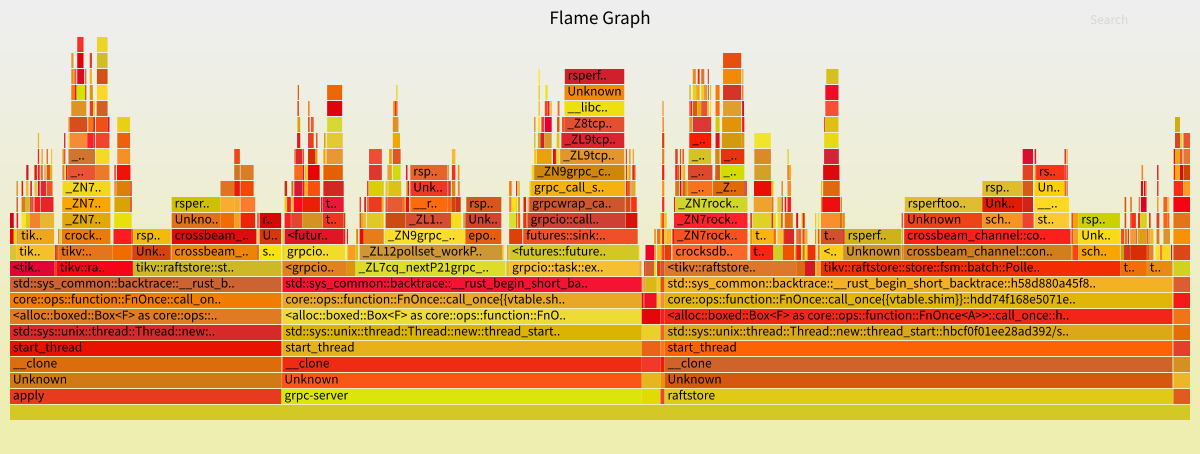
Here is an example of generated flamegraph:
## Frame Post Processor
Before the report was generated, `frame_post_processor` was provided as an interface to modify raw statistic data. If you want to group several symbols/thread or demangle for some symbols, this feature will benefit you.
For example:
```rust
fn frames_post_processor() -> impl Fn(&mut pprof::Frames) {
let thread_rename = [
(Regex::new(r"^grpc-server-\d*$").unwrap(), "grpc-server"),
(Regex::new(r"^cop-high\d*$").unwrap(), "cop-high"),
(Regex::new(r"^cop-normal\d*$").unwrap(), "cop-normal"),
(Regex::new(r"^cop-low\d*$").unwrap(), "cop-low"),
(Regex::new(r"^raftstore-\d*$").unwrap(), "raftstore"),
(Regex::new(r"^raftstore-\d*-\d*$").unwrap(), "raftstore"),
(Regex::new(r"^sst-importer\d*$").unwrap(), "sst-importer"),
(
Regex::new(r"^store-read-low\d*$").unwrap(),
"store-read-low",
),
(Regex::new(r"^rocksdb:bg\d*$").unwrap(), "rocksdb:bg"),
(Regex::new(r"^rocksdb:low\d*$").unwrap(), "rocksdb:low"),
(Regex::new(r"^rocksdb:high\d*$").unwrap(), "rocksdb:high"),
(Regex::new(r"^snap sender\d*$").unwrap(), "snap-sender"),
(Regex::new(r"^snap-sender\d*$").unwrap(), "snap-sender"),
(Regex::new(r"^apply-\d*$").unwrap(), "apply"),
(Regex::new(r"^future-poller-\d*$").unwrap(), "future-poller"),
];
move |frames| {
for (regex, name) in thread_rename.iter() {
if regex.is_match(&frames.thread_name) {
frames.thread_name = name.to_string();
}
}
}
}
```
```rust
if let Ok(report) = guard.frames_post_processor(frames_post_processor()).report().build() {
let file = File::create("flamegraph.svg").unwrap();
report.flamegraph(file).unwrap();
}
```
## Why not ...
There have been tons of profilers, why we create a new one? Here we make a comparison between `pprof-rs` and other popular profilers to help you choose the best fit one.
### gperftools
`gperftools` is also an integrated profiler. There is also a wrapper for `gperftools` in rust called [`cpuprofiler`](https://crates.io/crates/cpuprofiler) which makes it programmable for a rust program.
#### Pros
1. `pprof-rs` has a modern build system and can be integrated into a rust program easily while compiling `gperftools` statically is buggy.
2. `pprof-rs` has a native rust interface while `gperftools`'s wrapper is **just** a wrapper.
3. Programming with rust guarantees thread safety natively.
#### Cons
1. `gperftools` is a collection of performance analysis tools which contains cpu profiler, heap profiler... `pprof-rs` focuses on cpu profiler now.
### perf
`perf` is a performance analyzing tool in Linux.
#### Pros
1. You don't need to start another process to perf with `pprof-rs`.
2. `pprof-rs` can be easily integrated with rust program which means you don't need to install any other programs.
3. `pprof-rs` has a modern programmable interface to hack with
4. `pprof-rs` theoretically supports all POSIX systems and can easily support more systems in the future.
#### Cons
1. `perf` is much more feature-rich than `pprof-rs`.
2. `perf` is highly integrated with Linux.
## Implementation
When profiling was started, `setitimer` system call was used to set up a timer which will send a SIGPROF to this program every constant interval.
When receiving a SIGPROF signal, the signal handler will capture a backtrace and increase the count of it. After a while, the profiler can get every possible backtrace and their count. Finally, we can generate a report with profiler data.
However, the real world is full of thorns. There are many worths of note parts in the implementation.
### Backtrace
Unfortunately, there is no 100% robust stack tracing method. [Some related researches](https://github.com/gperftools/gperftools/wiki/gperftools%27-stacktrace-capturing-methods-and-their-issues) have been done by gperftools. `pprof-rs` uses [`backtrace-rs`](https://github.com/rust-lang/backtrace-rs) which finally uses libunwind provided by `glibc`
**WARN:** as described in former gperftools documents, libunwind provided by `glibc` is not signal safe.
> libgcc's unwind method is not safe to use from signal handlers. One particular cause of deadlock is when profiling tick happens when program is propagating thrown exception.
### Signal Safety
Signal safety is hard to guarantee. But it's not *that* hard.
First, we have to avoid deadlock. When profiler samples or reports, it will get a global lock on the profiler. Particularly, deadlock happenswhen the running program is getting a report from the profiler (which will hold the lock), at the same time, a SIGPROF signal is triggered and the profiler wants to sample (which will also hold the lock). So we don't wait for the lock in signal handler, instead we `try_lock` in the signal handler. If the global lock cannot be gotten, the profiler will give up directly.
Then, signal safety POSIX function is quite limited as [listed here](http://man7.org/linux/man-pages/man7/signal-safety.7.html). The most bothering issue is that we cannot use `malloc` in signal handler. So we can only use pre-allocated memory in profiler. The simplest way is `write` every sample serially into a file. We optimized it with a fix-sized hashmap that has a fixed number of buckets and every bucket is an array with a fixed number of items. If the hashmap is full, we pop out the item with minimum count and write it into a temporary file.
Unit tests have been added to guarantee there is no `malloc` in sample functions.
`futex` is also not safe to use in signal handler. So we use a spin lock to avoid usage of `futex`.
## TODO
1. Restore the original SIGPROF handler after stopping the profiler.
2. Support generating [pprof format results](https://github.com/google/pprof/blob/master/proto/profile.proto)