pprof
pprof is a cpu profiler which can be easily integrated into a rust program.
Usage
First, get a guard to start profiling. Profiling will continue until this guard was dropped.
let guard = new.unwrap;
During the profiling time, you can get report with guard.
if let Ok = guard.report.build ;
Display was implemented for Report. It will print a human-readable stack counter report. Here is an example:
FRAME: backtrace::backtrace::trace::h3e91a3123a3049a5 -> FRAME: pprof::profiler::perf_signal_handler::h7b995c4ab2e66493 -> FRAME: Unknown -> FRAME: prime_number::is_prime_number::h70653a2633b88023 -> FRAME: prime_number::main::h47f1058543990c8b -> FRAME: std::rt::lang_start::{{closure}}::h4262e250f8024b06 -> FRAME: std::rt::lang_start_internal::{{closure}}::h812f70926ebbddd0 -> std::panicking::try::do_call::h3210e2ce6a68897b -> FRAME: __rust_maybe_catch_panic -> FRAME: std::panicking::try::h28c2e2ec1c3871ce -> std::panic::catch_unwind::h05e542185e35aabf -> std::rt::lang_start_internal::hd7efcfd33686f472 -> FRAME: main -> FRAME: __libc_start_main -> FRAME: _start -> FRAME: Unknown -> THREAD: prime_number 1217
FRAME: backtrace::backtrace::trace::h3e91a3123a3049a5 -> FRAME: pprof::profiler::perf_signal_handler::h7b995c4ab2e66493 -> FRAME: Unknown -> FRAME: alloc::alloc::box_free::h82cea48ed688e081 -> FRAME: prime_number::main::h47f1058543990c8b -> FRAME: std::rt::lang_start::{{closure}}::h4262e250f8024b06 -> FRAME: std::rt::lang_start_internal::{{closure}}::h812f70926ebbddd0 -> std::panicking::try::do_call::h3210e2ce6a68897b -> FRAME: __rust_maybe_catch_panic -> FRAME: std::panicking::try::h28c2e2ec1c3871ce -> std::panic::catch_unwind::h05e542185e35aabf -> std::rt::lang_start_internal::hd7efcfd33686f472 -> FRAME: main -> FRAME: __libc_start_main -> FRAME: _start -> FRAME: Unknown -> THREAD: prime_number 1
FRAME: backtrace::backtrace::trace::h3e91a3123a3049a5 -> FRAME: pprof::profiler::perf_signal_handler::h7b995c4ab2e66493 -> FRAME: Unknown -> FRAME: prime_number::main::h47f1058543990c8b -> FRAME: std::rt::lang_start::{{closure}}::h4262e250f8024b06 -> FRAME: std::rt::lang_start_internal::{{closure}}::h812f70926ebbddd0 -> std::panicking::try::do_call::h3210e2ce6a68897b -> FRAME: __rust_maybe_catch_panic -> FRAME: std::panicking::try::h28c2e2ec1c3871ce -> std::panic::catch_unwind::h05e542185e35aabf -> std::rt::lang_start_internal::hd7efcfd33686f472 -> FRAME: main -> FRAME: __libc_start_main -> FRAME: _start -> FRAME: Unknown -> THREAD: prime_number 1
Flamegraph
= { = "0.3", = ["flamegraph"] }
If flamegraph feature is enabled, you can generate flamegraph from report. Report struct has a method flamegraph which can generate flamegraph and write it into a Write.
if let Ok = guard.report.build ;
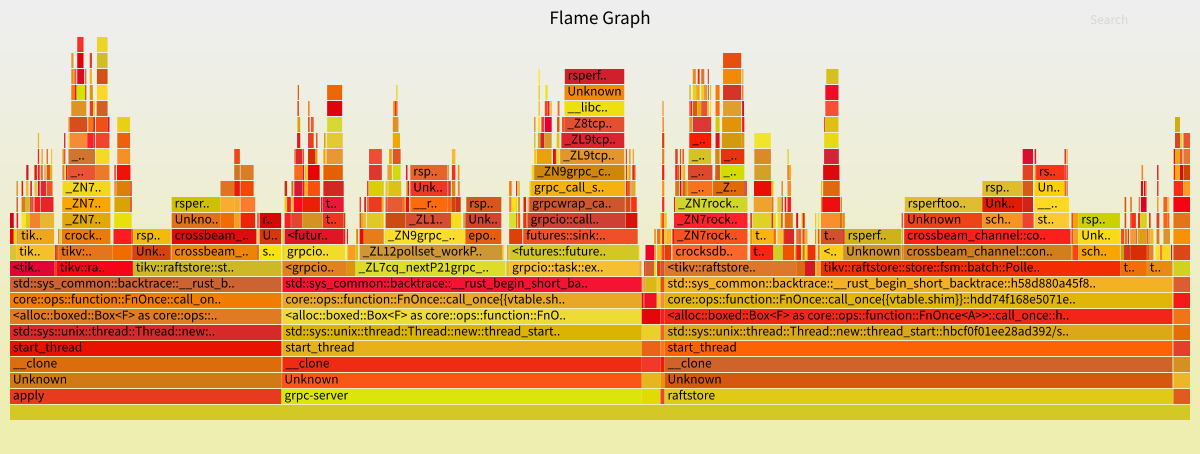
Here is an example of generated flamegraph: