Module plotters::chart [−][src]
Expand description
The high-level plotting abstractions.
Plotters uses ChartContext, a thin layer on the top of DrawingArea, to provide
high-level chart specific drawing functionalities, like, mesh line, coordinate label
and other common components for the data chart.
To draw a series, ChartContext::draw_series is used to draw a series on the chart.
In Plotters, a series is abstracted as an iterator of elements.
ChartBuilder is used to construct a chart. To learn more detailed information, check the
detailed description for each struct.
Structs
| ChartBuilder | The helper object to create a chart context, which is used for the high-level figure drawing. With the help of this object, we can convert a basic drawing area into a chart context, which allows the high-level charting API being used on the drawing area. |
| ChartContext | The context of the chart. This is the core object of Plotters. Any plot/chart is abstracted as this type, and any data series can be placed to the chart context. |
| ChartState | A chart context state - This is the data that is needed to reconstruct the chart context without actually drawing the chart. This is useful when we want to do realtime rendering and want to incrementally update the chart. |
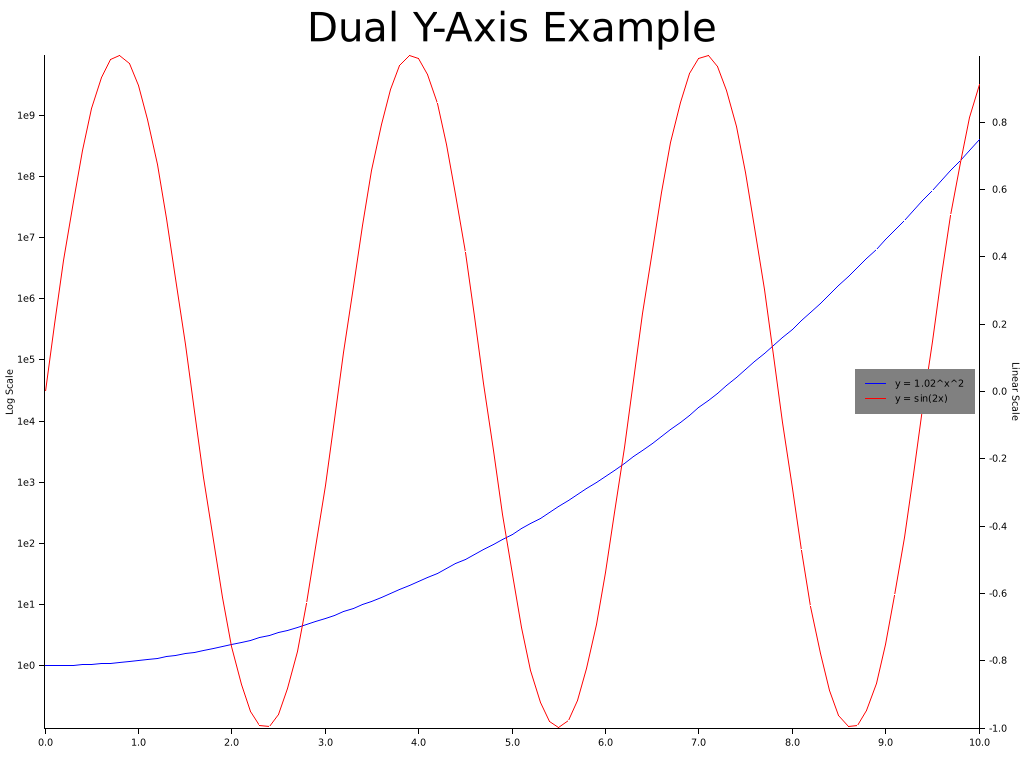
| DualCoordChartContext | The chart context that has two coordinate system attached.
This situation is quite common, for example, we with two different coodinate system.
For instance this example |
| DualCoordChartState | The chart state for a dual coord chart, see the detailed description for |
| MeshStyle | The struct that is used for tracking the configuration of a mesh of any chart |
| SecondaryMeshStyle | The style used to describe the mesh and axis for a secondary coordinate system. |
| SeriesAnno | The annotations (such as the label of the series, the legend element, etc) When a series is drawn onto a drawing area, an series annotation object is created and a mutable reference is returned. |
| SeriesLabelStyle | The struct to specify the series label of a target chart context |
 This is done by attaching a second coordinate system to ChartContext by method
 Enums
| LabelAreaPosition | The enum used to specify the position of label area. This is used when we configure the label area size with the API ChartBuilder::set_label_area_size(struct ChartBuilder.html#method.set_label_area_size) |
| SeriesLabelPosition | Describes where we want to put the series label |