import matplotlib.pyplot as plt
import ndjson
chartgroup_defs = [
{
'charts': [
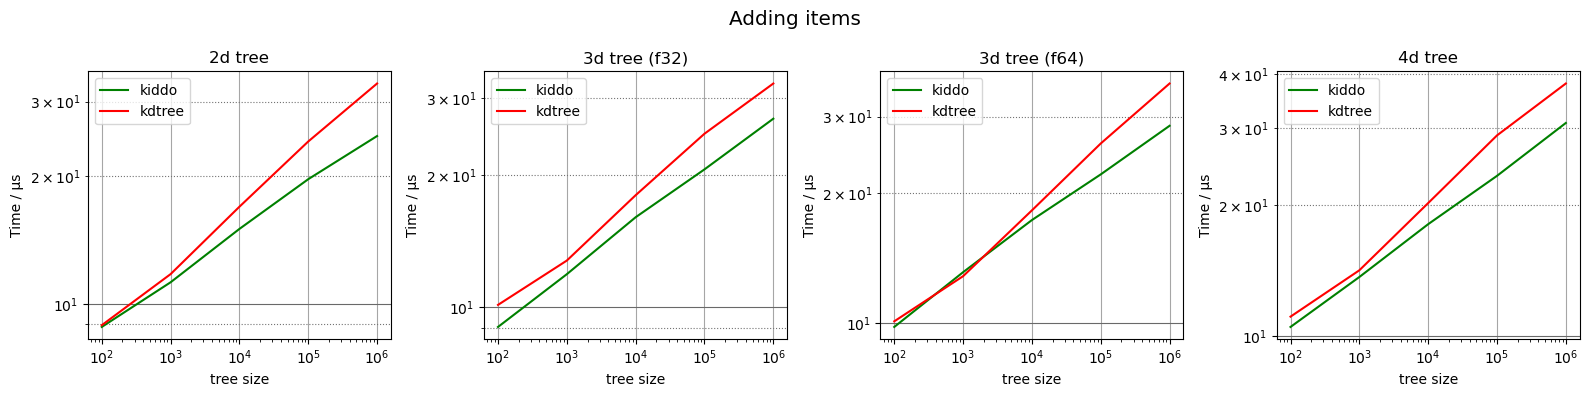
{ 'source': 'add 100 items to 2d kdtree of increasing size', 'title': '2d tree' },
{ 'source': 'add 100 items to 3d kdtree (f32) of increasing size', 'title': '3d tree (f32)' },
{ 'source': 'add 100 items to 3d kdtree of increasing size', 'title': '3d tree (f64)' },
{ 'source': 'add 100 items to 4d kdtree of increasing size', 'title': '4d tree' },
],
'log_time': True,
'n_rows': 1,
'group_title': "Adding items",
'output_filename': "benchmark_adding"
},
{
'charts': [
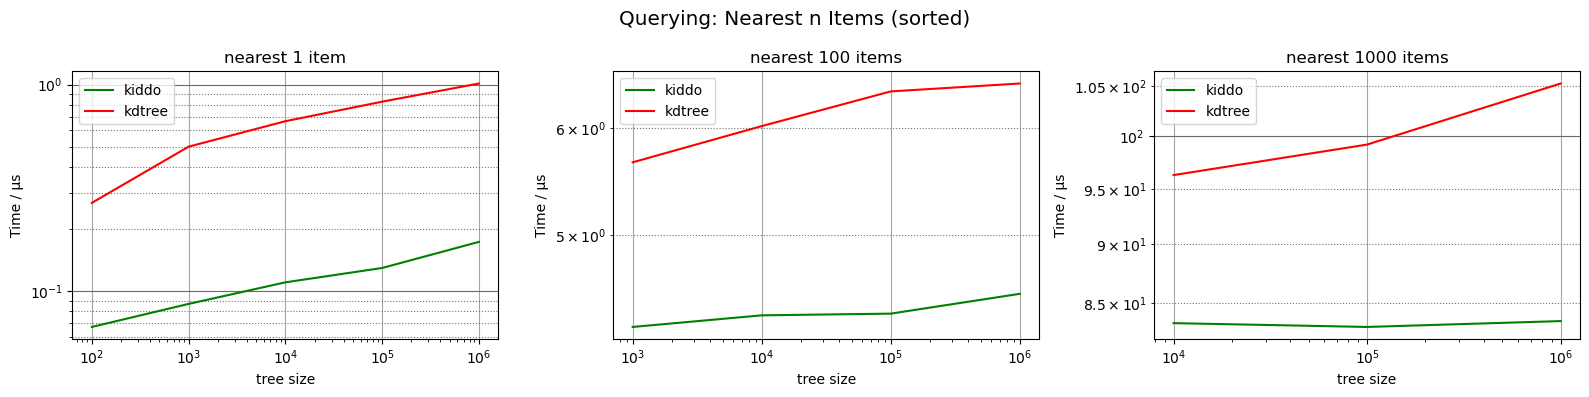
{ 'source': 'nearest(1)', 'title': 'nearest 1 item' },
{ 'source': 'nearest(100)', 'title': 'nearest 100 items' },
{ 'source': 'nearest(1000)', 'title': 'nearest 1000 items' },
],
'log_time': True,
'n_rows': 1,
'group_title': "Querying: Nearest n Items (sorted)",
'output_filename': "benchmark_nearest_n"
},
{
'charts': [
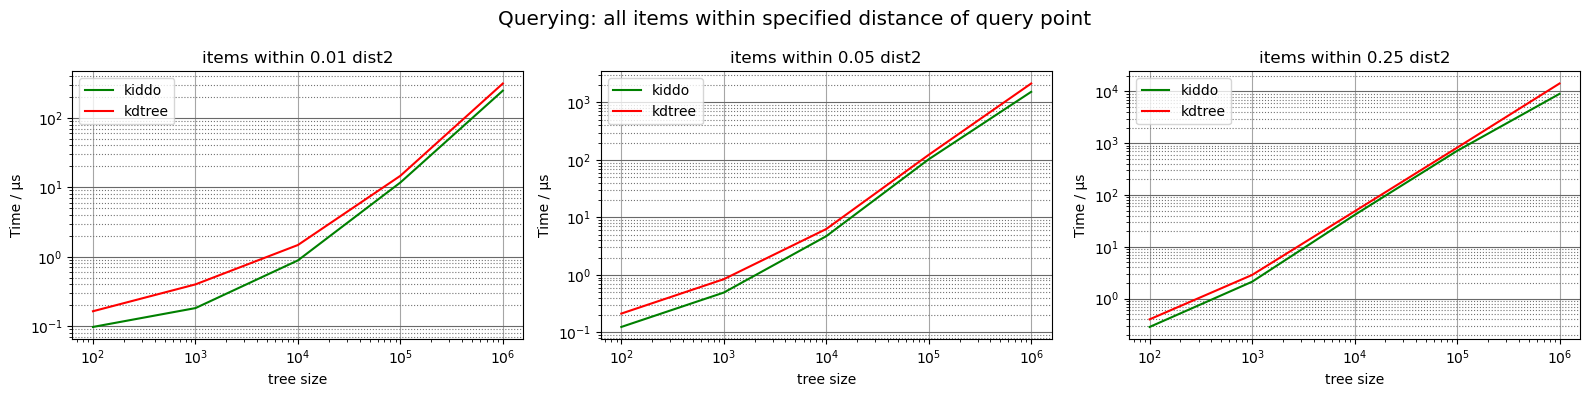
{ 'source': 'within(0.01)', 'title': 'items within 0.01 dist2' },
{ 'source': 'within(0.05)', 'title': 'items within 0.05 dist2' },
{ 'source': 'within(0.25)', 'title': 'items within 0.25 dist2' },
],
'log_time': True,
'n_rows': 1,
'group_title': "Querying: all items within specified distance of query point",
'output_filename': "benchmark_within"
},
{
'charts': [
{ 'source': 'within_unsorted(0.01)', 'title': 'unsorted items within 0.01 dist2' },
{ 'source': 'within_unsorted(0.05)', 'title': 'unsorted items within 0.05 dist2' },
{ 'source': 'within_unsorted(0.25)', 'title': 'unsorted items within 0.25 dist2' },
],
'log_time': True,
'n_rows': 1,
'group_title': "Querying: all items (unsorted) within specified distance of query point",
'output_filename': "benchmark_within_unsorted"
},
{
'charts': [
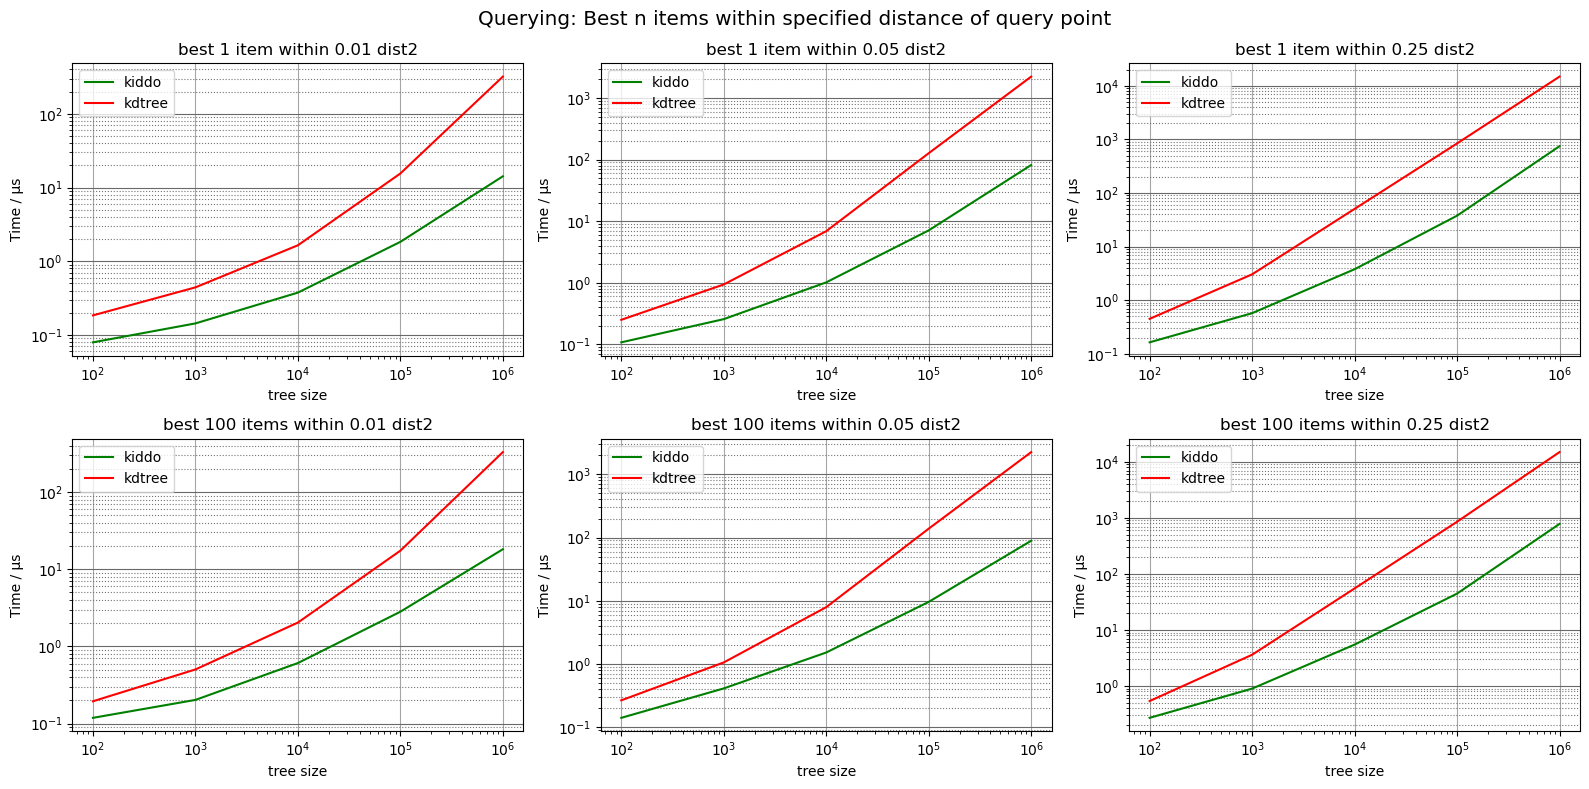
{ 'source': 'best 1: within(0.01)', 'title': 'best 1 item within 0.01 dist2' },
{ 'source': 'best 1: within(0.05)', 'title': 'best 1 item within 0.05 dist2' },
{ 'source': 'best 1: within(0.25)', 'title': 'best 1 item within 0.25 dist2' },
{ 'source': 'best 100: within(0.01)', 'title': 'best 100 items within 0.01 dist2' },
{ 'source': 'best 100: within(0.05)', 'title': 'best 100 items within 0.05 dist2' },
{ 'source': 'best 100: within(0.25)', 'title': 'best 100 items within 0.25 dist2' },
],
'log_time': True,
'n_rows': 2,
'group_title': "Querying: Best n items within specified distance of query point",
'output_filename': "benchmark_best_n_within"
},
]
def transform_criterion_data(bench_data):
results = {}
for result in bench_data:
if result['reason'] == 'benchmark-complete':
key_frags = result['id'].split('/')
if key_frags[0] not in results:
results[key_frags[0]] = {}
results[key_frags[0]][key_frags[1]] = result['typical']
return results
def data_for_benchmark(data, name):
x = [int(x) for x in data[name].keys()]
y = [r['estimate'] / 1000 for r in data[name].values()]
return [ x, y ]
def render_chart_group(data, data_names, chartdef, y_is_logarithmic, n_rows, sup_title, output_filename):
n_cols = len(chartdef) // n_rows
fig, ax = plt.subplots(nrows=n_rows, ncols=n_cols, figsize=(16,4 * n_rows), facecolor='w', edgecolor='k')
for idx, chart in enumerate(chartdef):
if n_rows == 1:
crt = ax[idx]
else:
crt = ax[idx // n_cols][idx % n_cols]
for series_idx, series in enumerate(data):
d = data_for_benchmark(series, chart['source'])
crt.plot(d[0], d[1], data_names[series_idx][1], label=data_names[series_idx][0])
if y_is_logarithmic:
crt.set_yscale('log')
crt.set_xscale('log')
crt.set_title(chart['title'])
crt.set_xlabel('tree size')
crt.set_ylabel('Time / μs')
if y_is_logarithmic == False:
crt.set_ylim([0, None])
crt.legend()
crt.grid(True, axis='x', which="major", ls="-", color='0.65')
crt.grid(True, axis='y', which='major', linestyle='-', color='dimgrey')
crt.grid(True, axis='y', which='minor', linestyle=':', color='0.45')
if sup_title is not None:
fig.suptitle(sup_title, size='x-large')
plt.tight_layout()
plt.savefig(output_filename + '.png', transparent=False, bbox_inches='tight')
def render_chart_group_def(data, data_labels, chart_group_def):
render_chart_group(data, data_labels, chart_group_def['charts'], chart_group_def['log_time'], chart_group_def['n_rows'], chart_group_def['group_title'], chart_group_def['output_filename'])
def render_chart_group_defs(data, data_labels, chart_group_defs):
for chart_group_def in chart_group_defs:
render_chart_group_def(data, data_labels, chart_group_def)
with open("./criterion-kiddo.ndjson") as datafile:
data_kiddo = ndjson.load(datafile)
with open("./criterion-kdtree.ndjson") as datafile:
data_kdtree = ndjson.load(datafile)
data_labels = [
['kiddo', 'green'],
['kdtree', 'red']
]
data = [
transform_criterion_data(data_kiddo),
transform_criterion_data(data_kdtree)
]
render_chart_group_defs(data, data_labels, chartgroup_defs)