hist-cli-0.4.5 is not a library.
hist
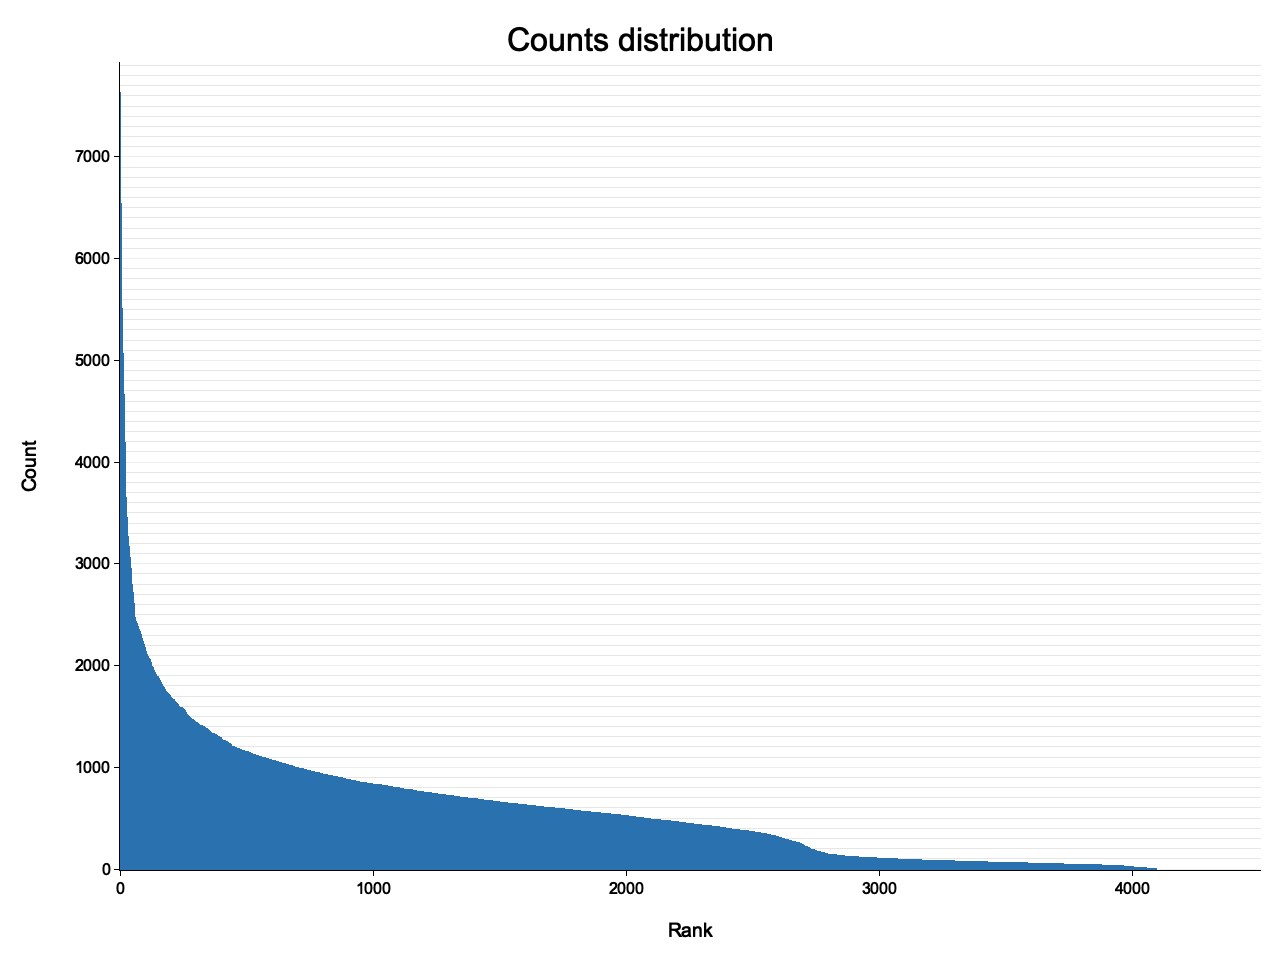
Commandline tool for plotting frequency ranked histograms of TSV/CSV data.
Installation
$ cargo install hist-cli
export PATH="$HOME/.cargo/bin:$PATH"
Usage
hist 0.4.5
Plots histogram of input

USAGE:
    hist [FLAGS] [OPTIONS] [input]

FLAGS:
    -h, --help        Prints help information
    -n, --nooutput    do not save a PNG plot to a file
    -t, --textplot    also plot a textplot to STDOUT
    -V, --version     Prints version information

OPTIONS:
    -T, --Title <Title>            optional title above the plot [default: Counts distribution]
    -d, --delimiter <delimiter>    column delimiter [default: \t]
    -g, --geometry <geometry>      the x and y size of the plot [default: 1280x960]
    -k, --key <key>                key (column) selector [default: 1]
    -o, --output <output>          file to save PNG plot to [default: histogram.png]
    -s, --save <save>              save counts data to file as TSV, use - for STDOUT
        --xdesc <xdesc>            x-axis label [default: Rank]
        --ydesc <ydesc>            y-axis label [default: Counts]

ARGS:
    <input>    optional file with on entry per line [default: STDIN]
Just piping from stdin:
$ cut -f 1 data.tsv | hist
$ open histogram.png # on MacOS, on Linux maybe display or eog
$ cut -f 1 data.tsv > data.tsv.1; hist data.tsv.1 -o histogram2.png
$ echo a3 b2 b2 a3 a3 c4 c4 c4 c4 | tr ' ' '\n' | hist -n -t

# not plot at all, just replace: sort | uniq -c | sort -n
$ echo a3 b2 b2 a3 a3 c4 c4 c4 c4 | tr ' ' '\n' | hist -n -s -
2       b2
3       a3
4       c4