Expand description
Customizable graphing calculator.
This module provides basic graphing functionality, such as plotting expressions and points, then rendering the result to an image.
To build an image of a graph, create a Graph and add expressions and / or points to it
using Graph::add_expr / Graph::try_add_expr and Graph::add_point. Then, call
Graph::draw() to render the graph to an image. This crate uses the cairo crate to
render the graph, and thus can render to any format supported by cairo, including PNG and
SVG.
§Adding expressions
The argument to Graph::try_add_expr() is any expression that can be parsed by
cas_parser as an Expr. If you have an Expr already, you can use
Graph::add_expr().
The given expression should be one defined in terms of the variables x (horizontal axis), y
(vertical axis), or both, with an optional y == or x == prefix / suffix to clearly indicate
the dependent variable. For example, the following are all valid expressions:
y == 0.8214285714x^2 + 4.3785714286x + 70.8214285714x^2 + 4.3785714286x + 7sin(x) == ysin(y)x == sin(y)x^2 + y^2 == 1TODO: relations are not yet supported- etc.
§Customizing visuals
The graph can be configured by passing a custom GraphOptions to Graph::with_opts to
customize the viewport size, scale, and grid divisions. See GraphOptions for a description
of each option along with their defaults.
§Example
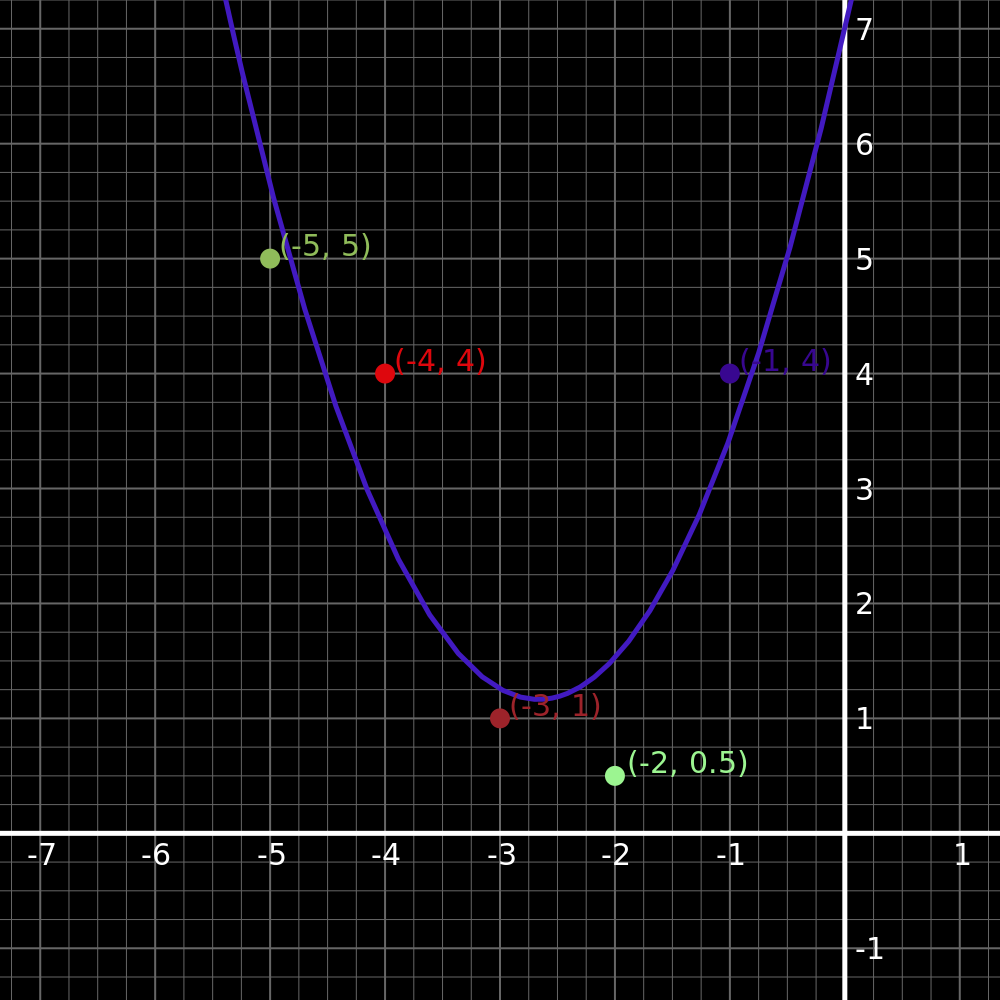
The following example creates a graph with the expression
y == 0.8214285714x^2 + 4.3785714286x + 7 and a few points with the viewport centered on the
added points. The graph is then rendered to a PNG file.
use cas_graph::{Graph, GraphOptions};
use std::fs::File;

fn main() -> Result<(), Box<dyn std::error::Error>> {
    let opts = GraphOptions::default()
        .square_scale(true); // scales the x- and y-axes together, looks nicer in my opinion
    let surface = Graph::with_opts(opts)
        .try_add_expr("y == 0.8214285714x^2 + 4.3785714286x + 7").unwrap()
    //  .try_add_expr("0.8214285714x^2 + 4.3785714286x + 7").unwrap() // "y==" can be omitted
        .add_point((-5.0, 5.0))
        .add_point((-4.0, 4.0))
        .add_point((-3.0, 1.0))
        .add_point((-2.0, 0.5))
        .add_point((-1.0, 4.0))
        .center_on_points()
        .draw()?;

    let mut file = File::create("output.png")?;
    surface.write_to_png(&mut file)?;

    Ok(())
}
Output (note: colors were randomly chosen; random color selection is not included in the example code):
Re-exports§
pub use point::CanvasPoint;pub use point::GraphPoint;pub use point::Point;pub use opts::GraphOptions;
Modules§
Structs§
- Graph
- A graph containing expressions and points to draw.