  1
  2
  3
  4
  5
  6
  7
  8
  9
 10
 11
 12
 13
 14
 15
 16
 17
 18
 19
 20
 21
 22
 23
 24
 25
 26
 27
 28
 29
 30
 31
 32
 33
 34
 35
 36
 37
 38
 39
 40
 41
 42
 43
 44
 45
 46
 47
 48
 49
 50
 51
 52
 53
 54
 55
 56
 57
 58
 59
 60
 61
 62
 63
 64
 65
 66
 67
 68
 69
 70
 71
 72
 73
 74
 75
 76
 77
 78
 79
 80
 81
 82
 83
 84
 85
 86
 87
 88
 89
 90
 91
 92
 93
 94
 95
 96
 97
 98
 99
100
101
102
103
104
105
106
107
108
109
110
111
112
113
114
115
116
117
118
119
120
121
122
123
124
125
126
127
128
129
130
131
132
133
134
135
136
137
138
139
140
141
142
143
144
145
146
147
148
149
150
151
152
153
154
155
156
157
158
159
160
161
162
163
164
165
166
167
168
169
170
171
172
173
174
175
176
177
178
179
180
181
182
183
184
185
186
187
188
189
190
191
192
193
194
195
196
197
198
199
200
201
202
203
204
205
206
207
208
209
210
211
212
213
214
215
216
217
218
219
220
221
222
223
224
225
226
227
228
229
230
231
232
233
234
235
236
237
238
239
240
241
242
243
244
245
246
247
248
249
250
251
252
253
254
255
256
257
258
259
260
261
262
263
264
265
266
267
268
269
270
271
272
273
274
275
276
277
278
279
280
281
282
283
284
285
286
287
288
289
290
291
292
293
294
295
296
297
298
299
300
301
302
303
304
305
306
307
308
309
310
311
312
313
314
315
316
317
318
319
320
321
322
323
324
325
326
327
328
329
330
331
332
333
334
335
336
337
338
339
340
341
342
343
344
345
346
347
348
349
350
351
352
353
354
355
356
357
358
359
360
361
362
363
364
365
366
367
368
369
370
371
372
373
374
375
376
377
378
379
380
381
382
383
384
385
386
387
388
389
390
391
392
393
394
395
396
397
398
399
400
401
402
403
404
405
406
407
408
409
410
411
412
413
414
415
416
417
418
419
420
421
422
423
424
425
426
427
428
429
430
431
432
433
434
435
436
437
438
439
440
441
442
443
444
445
446
447
448
449
450
451
452
453
454
455
456
457
458
459
460
461
462
463
464
465
466
467
468
469
470
471
472
473
474
475
476
477
478
479
480
481
482
483
484
485
486
487
488
489
490
491
492
493
494
495
496
497
498
499
500
501
502
503
504
505
506
507
508
509
510
511
512
513
514
515
516
517
518
519
520
521
522
523
524
525
526
527
528
529
530
531
532
533
534
535
536
537
538
539
540
541
542
543
544
545
546
547
548
549
550
551
552
553
554
555
556
557
558
559
560
561
562
563
564
565
566
567
568
569
570
571
572
573
574
575
576
577
578
579
580
581
582
583
584
585
586
587
588
589
590
591
592
593
594
595
596
597
598
599
600
601
602
603
604
605
606
607
608
609
610
611
612
613
614
615
616
617
618
619
620
621
622
623
624
625
626
627
628
629
630
631
632
633
634
635
636
637
638
639
640
641
642
643
644
645
646
647
648
649
650
651
652
653
654
655
656
657
658
659
660
661
662
663
664
665
666
667
668
669
670
671
672
673
674
675
676
677
678
679
680
681
682
683
684
685
686
687
688
689
690
691
692
693
694
695
696
697
698
699
700
701
702
703
704
705
706
707
708
709
710
711
712
713
714
715
716
717
718
719
720
721
722
723
724
725
726
727
728
729
730
731
732
733
734
735
736
737
738
739
740
741
742
743
744
745
746
747
748
749
750
751
752
753
754
755
756
757
758
759
760
761
762
763
764
765
766
767
768
769
770
771
772
773
774
775
776
777
778
779
780
781
782
783
784
785
786
787
788
789
790
791
792
793
794
795
796
797
798
799
800
801
802
803
804
805
806
807
808
809
810
811
812
813
814
815
816
817
818
819
820
821
822
823
824
825
826
827
828
829
830
831
832
833
834
/*! # Plotters - A Rust drawing library focus on data plotting for both WASM and native applications 🦀📈🚀 <a href="https://crates.io/crates/plotters"> <img style="display: inline!important" src="https://img.shields.io/crates/v/plotters.svg"></img> </a> <a href="https://docs.rs/plotters"> <img style="display: inline!important" src="https://docs.rs/plotters/badge.svg"></img> </a> <a href="https://plotters-rs.github.io/rustdoc/plotters/"> <img style="display: inline! important" src="https://img.shields.io/badge/docs-development-lightgrey.svg"></img> </a> <a href="https://travis-ci.org/38/plotters"> <img style="display: inline! important" src="https://travis-ci.org/38/plotters.svg?branch=master"></img> </a> <a href="https://codecov.io/gh/38/plotters"> <img style="display: inline! important" src="https://codecov.io/gh/38/plotters/branch/master/graph/badge.svg" /> </a> Plotters is drawing library designed for rendering figures, plots, and charts, in pure rust. Plotters supports various types of back-ends, including bitmap, vector graph, piston window, GTK/Cairo and WebAssembly. - A new Plotters Developer's Guide is working in progress. The preview version is available at [here](https://plotters-rs.github.io/book). - To try Plotters with interactive Jupyter notebook, or view [here](https://plotters-rs.github.io/plotters-doc-data/evcxr-jupyter-integration.html) for the static HTML version. - To view the WASM example, go to this [link](https://plumberserver.com/plotters-wasm-demo/index.html) - Currently we have all the internal code ready for console plotting, but a console based backend is still not ready. See [this example](https://github.com/38/plotters/blob/master/examples/console.rs) for how to plotting on Console with a customized backend. - Plotters now moved all backend code to sperate repository, check [FAQ list](#faq-list) for details ## Gallery <div class="galleryItem"> <a href="https://plotters-rs.github.io/plotters-doc-data/sample.png"> <img src="https://plotters-rs.github.io/plotters-doc-data/sample.png" class="galleryItem"></img> </a> <div class="galleryText"> Multiple Plot <a href="https://github.com/38/plotters/blob/master/examples/chart.rs">[code]</a> </div> </div> <div class="galleryItem"> <a href="https://plotters-rs.github.io/plotters-doc-data/stock.png"> <img src="https://plotters-rs.github.io/plotters-doc-data/stock.png" class="galleryItem"></img> </a> <div class="galleryText"> Candlestick Plot <a href="https://github.com/38/plotters/blob/master/examples/stock.rs">[code]</a> </div> </div> <div class="galleryItem"> <a href="https://plotters-rs.github.io/plotters-doc-data/histogram.png"> <img src="https://plotters-rs.github.io/plotters-doc-data/histogram.png" class="galleryItem"></img> </a> <div class="galleryText"> Histogram <a href="https://github.com/38/plotters/blob/master/examples/histogram.rs">[code]</a> </div> </div> <div class="galleryItem"> <a href="https://plotters-rs.github.io/plotters-doc-data/0.png"> <img src="https://plotters-rs.github.io/plotters-doc-data/0.png" class="galleryItem"></img> </a> <div class="galleryText"> Simple Chart </div> </div> <div class="galleryItem"> <a href="https://plotters-rs.github.io/plotters-doc-data/console-2.png"> <img src="https://plotters-rs.github.io/plotters-doc-data/console-2.png" class="galleryItem"></img> </a> <div class="galleryText"> Plotting the Console </div> </div> <div class="galleryItem"> <a href="https://plotters-rs.github.io/plotters-doc-data/mandelbrot.png"> <img src="https://plotters-rs.github.io/plotters-doc-data/mandelbrot.png" class="galleryItem"></img> </a> <div class="galleryText"> Mandelbrot set <a href="https://github.com/38/plotters/blob/master/examples/mandelbrot.rs">[code]</a> </div> </div> <div class="galleryItem"> <a href="https://plotters-rs.github.io/plotters-doc-data/evcxr_animation.gif"> <img src="https://plotters-rs.github.io/plotters-doc-data/evcxr_animation.gif" class="galleryItem"></img> </a> <div class="galleryText"> Jupyter Support </div> </div> <div class="galleryItem"> <a href="https://plotters-rs.github.io/plotters-doc-data/plotters-piston.gif"> <img src="https://plotters-rs.github.io/plotters-doc-data/plotters-piston.gif" class="galleryItem"></img> </a> <div class="galleryText"> Real-time Rendering <a href="https://github.com/plotters-rs/plotters-piston/blob/master/examples/cpustat.rs">[code]</a> </div> </div> <div class="galleryItem"> <a href="https://plotters-rs.github.io/plotters-doc-data/normal-dist.png"> <img src="https://plotters-rs.github.io/plotters-doc-data/normal-dist.png" class="galleryItem"></img> </a> <div class="galleryText"> Histogram with Scatter <a href="https://github.com/38/plotters/blob/master/examples/normal-dist.rs">[code]</a> </div> </div> <div class="galleryItem"> <a href="https://plotters-rs.github.io/plotters-doc-data/twoscale.png"> <img src="https://plotters-rs.github.io/plotters-doc-data/twoscale.png" class="galleryItem"></img> </a> <div class="galleryText"> Dual Y-Axis Example <a href="https://github.com/38/plotters/blob/master/examples/two-scales.rs">[code]</a> </div> </div> <div class="galleryItem"> <a href="https://plotters-rs.github.io/plotters-doc-data/matshow.png"> <img src="https://plotters-rs.github.io/plotters-doc-data/matshow.png" class="galleryItem"></img> </a> <div class="galleryText"> The Matplotlib Matshow Example <a href="https://github.com/38/plotters/blob/master/examples/matshow.rs">[code]</a> </div> </div> <div class="galleryItem"> <a href="https://plotters-rs.github.io/plotters-doc-data/sierpinski.png"> <img src="https://plotters-rs.github.io/plotters-doc-data/sierpinski.png" class="galleryItem"></img> </a> <div class="galleryText"> The Sierpinski Carpet <a href="https://github.com/38/plotters/blob/master/examples/sierpinski.rs">[code]</a> </div> </div> <div class="galleryItem"> <a href="https://plotters-rs.github.io/plotters-doc-data/normal-dist2.png"> <img src="https://plotters-rs.github.io/plotters-doc-data/normal-dist2.png" class="galleryItem"></img> </a> <div class="galleryText"> The 1D Gaussian Distribution <a href="https://github.com/38/plotters/blob/master/examples/nomal-dist2.rs">[code]</a> </div> </div> <div class="galleryItem"> <a href="https://plotters-rs.github.io/plotters-doc-data/errorbar.png"> <img src="https://plotters-rs.github.io/plotters-doc-data/errorbar.png" class="galleryItem"></img> </a> <div class="galleryText"> The 1D Gaussian Distribution <a href="https://github.com/38/plotters/blob/master/examples/errorbar.rs">[code]</a> </div> </div> <div class="galleryItem"> <a href="https://plotters-rs.github.io/plotters-doc-data/slc-temp.png"> <img src="https://plotters-rs.github.io/plotters-doc-data/slc-temp.png" class="galleryItem"></img> </a> <div class="galleryText"> Monthly Time Coordinate <a href="https://github.com/38/plotters/blob/master/examples/slc-temp.rs">[code]</a> </div> </div> <div class="galleryItem"> <a href="https://plotters-rs.github.io/plotters-doc-data/area-chart.png"> <img src="https://plotters-rs.github.io/plotters-doc-data/area-chart.png" class="galleryItem"></img> </a> <div class="galleryText"> Monthly Time Coordinate <a href="https://github.com/38/plotters/blob/master/examples/area-chart.rs">[code]</a> </div> </div> <div class="galleryItem"> <a href="https://plotters-rs.github.io/plotters-doc-data/snowflake.png"> <img src="https://plotters-rs.github.io/plotters-doc-data/snowflake.png" class="galleryItem"></img> </a> <div class="galleryText"> Koch Snowflake <a href="https://github.com/38/plotters/blob/master/examples/snowflake.rs">[code]</a> </div> </div> <div class="galleryItem"> <a href="https://plotters-rs.github.io/plotters-doc-data/animation.gif"> <img src="https://plotters-rs.github.io/plotters-doc-data/animation.gif" class="galleryItem"></img> </a> <div class="galleryText"> Koch Snowflake Animation <a href="https://github.com/38/plotters/blob/master/examples/animation.rs">[code]</a> </div> </div> <div class="galleryItem"> <a href="https://plotters-rs.github.io/plotters-doc-data/console.png"> <img src="https://plotters-rs.github.io/plotters-doc-data/console.png" class="galleryItem"></img> </a> <div class="galleryText"> Drawing on a Console <a href="https://github.com/38/plotters/blob/master/examples/console.rs">[code]</a> </div> </div> <div class="galleryItem"> <a href="https://plotters-rs.github.io/plotters-doc-data/blit-bitmap.png"> <img src="https://plotters-rs.github.io/plotters-doc-data/blit-bitmap.png" class="galleryItem"></img> </a> <div class="galleryText"> Drawing bitmap on chart <a href="https://github.com/38/plotters/blob/master/examples/blit-bitmap.rs">[code]</a> </div> </div> <div class="galleryItem"> <a href="https://plotters-rs.github.io/plotters-doc-data/boxplot.svg"> <img src="https://plotters-rs.github.io/plotters-doc-data/boxplot.svg" class="galleryItem"></img> </a> <div class="galleryText"> The boxplot demo <a href="https://github.com/38/plotters/blob/master/examples/boxplot.rs">[code]</a> </div> </div> <div class="galleryItem"> <a href="https://plotters-rs.github.io/plotters-doc-data/3d-plot.svg"> <img src="https://plotters-rs.github.io/plotters-doc-data/3d-plot.svg" class="galleryItem"></img> </a> <div class="galleryText"> 3D plot rendering <a href="https://github.com/38/plotters/blob/master/examples/3d-plot.rs">[code]</a> </div> </div> <div class="galleryItem"> <a href="https://plotters-rs.github.io/plotters-doc-data/3d-plot2.gif"> <img src="https://plotters-rs.github.io/plotters-doc-data/3d-plot2.gif" class="galleryItem"></img> </a> <div class="galleryText"> 2-Var Gussian Distribution PDF <a href="https://github.com/38/plotters/blob/master/examples/3d-plot2.rs">[code]</a> </div> </div> <div class="galleryItem"> <a href="https://plotters-rs.github.io/plotters-doc-data/tick_control.svg"> <img src="https://plotters-rs.github.io/plotters-doc-data/tick_control.svg" class="galleryItem"></img> </a> <div class="galleryText"> COVID-19 Visualization <a href="https://github.com/38/plotters/blob/master/examples/tick_control.rs">[code]</a> </div> </div> ## Table of Contents * [Gallery](#gallery) * [Quick Start](#quick-start) * [Trying with Jupyter evcxr Kernel Interactively](#trying-with-jupyter-evcxr-kernel-interactively) * [Interactive Tutorial with Jupyter Notebook](#interactive-tutorial-with-jupyter-notebook) * [Plotting in Rust](#plotting-in-rust) * [Plotting on HTML5 canvas with WASM Backend](#plotting-on-html5-canvas-with-wasm-backend) * [What types of figure are supported?](#what-types-of-figure-are-supported) * [Concepts by examples](#concepts-by-examples) + [Drawing Back-ends](#drawing-back-ends) + [Drawing Area](#drawing-area) + [Elements](#elements) + [Composable Elements](#composable-elements) + [Chart Context](#chart-context) * [Misc](#misc) + [Development Version](#development-version) + [Reducing Depending Libraries && Turning Off Backends](#reducing-depending-libraries--turning-off-backends) + [List of Features](#list-of-features) * [FAQ List](#faq-list) ## Quick Start To use Plotters, you can simply add Plotters into your `Cargo.toml` ```toml [dependencies] plotters = "^0.3.1" ``` And the following code draws a quadratic function. `src/main.rs`, ```rust use plotters::prelude::*; fn main() -> Result<(), Box<dyn std::error::Error>> { let root = BitMapBackend::new("plotters-doc-data/0.png", (640, 480)).into_drawing_area(); root.fill(&WHITE)?; let mut chart = ChartBuilder::on(&root) .caption("y=x^2", ("sans-serif", 50).into_font()) .margin(5) .x_label_area_size(30) .y_label_area_size(30) .build_cartesian_2d(-1f32..1f32, -0.1f32..1f32)?; chart.configure_mesh().draw()?; chart .draw_series(LineSeries::new( (-50..=50).map(|x| x as f32 / 50.0).map(|x| (x, x * x)), &RED, ))? .label("y = x^2") .legend(|(x, y)| PathElement::new(vec![(x, y), (x + 20, y)], &RED)); chart .configure_series_labels() .background_style(&WHITE.mix(0.8)) .border_style(&BLACK) .draw()?; Ok(()) } ``` 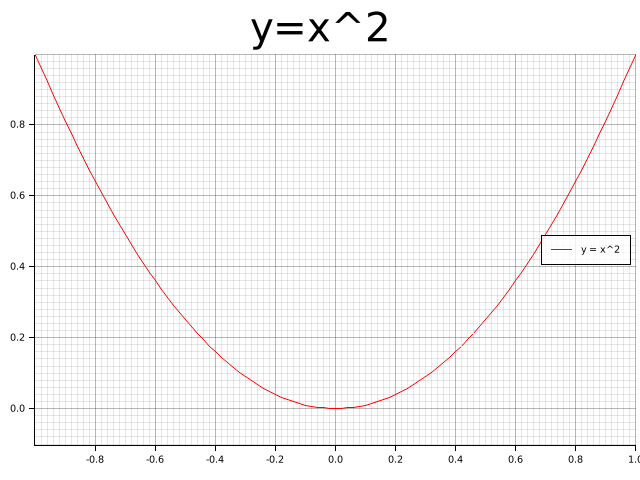 ## Trying with Jupyter evcxr Kernel Interactively Plotters now supports integrate with `evcxr` and is able to interactively drawing plots in Jupyter Notebook. The feature `evcxr` should be enabled when including Plotters to Jupyter Notebook. The following code shows a minimal example of this. ```text :dep plotters = { git = "https://github.com/38/plotters", default_features = false, features = ["evcxr"] } extern crate plotters; use plotters::prelude::*; let figure = evcxr_figure((640, 480), |root| { root.fill(&WHITE); let mut chart = ChartBuilder::on(&root) .caption("y=x^2", ("Arial", 50).into_font()) .margin(5) .x_label_area_size(30) .y_label_area_size(30) .build_cartesian_2d(-1f32..1f32, -0.1f32..1f32)?; chart.configure_mesh().draw()?; chart.draw_series(LineSeries::new( (-50..=50).map(|x| x as f32 / 50.0).map(|x| (x, x * x)), &RED, )).unwrap() .label("y = x^2") .legend(|(x,y)| PathElement::new(vec![(x,y), (x + 20,y)], &RED)); chart.configure_series_labels() .background_style(&WHITE.mix(0.8)) .border_style(&BLACK) .draw()?; Ok(()) }); figure ``` <img src="https://plotters-rs.github.io/plotters-doc-data/evcxr_animation.gif" width="450px"></img> ## Interactive Tutorial with Jupyter Notebook *This tutorial is now working in progress and isn't complete* Thanks to the evcxr, now we have an interactive tutorial for Plotters! To use the interactive notebook, you must have Jupyter and evcxr installed on your computer. Follow the instruction on [this page](https://github.com/google/evcxr/tree/master/evcxr_jupyter) below to install it. After that, you should be able to start your Jupyter server locally and load the tutorial! ```bash git clone https://github.com/38/plotters-doc-data cd plotteres-doc-data jupyter notebook ``` And select the notebook called `evcxr-jupyter-integration.ipynb`. Also, there's a static HTML version of this notebook available at the [this location](https://plumberserver.com/plotters-docs/evcxr-jupyter-integration.html) ## Plotting in Rust Rust is a perfect language for data visualization. Although there are many mature visualization libraries in many different languages. But Rust is one of the best languages fits the need. * **Easy to use** Rust has a very good iterator system built into the standard library. With the help of iterators, Plotting in Rust can be as easy as most of the high-level programming languages. The Rust based plotting library can be very easy to use. * **Fast** If you need rendering a figure with trillions of data points, Rust is a good choice. Rust's performance allows you to combine data processing step and rendering step into a single application. When plotting in high-level programming languages, e.g. Javascript or Python, data points must be down-sampled before feeding into the plotting program because of the performance considerations. Rust is fast enough to do the data processing and visualization within a single program. You can also integrate the figure rendering code into your application handling a huge amount of data and visualize it in real-time. * **WebAssembly Support** Rust is one of few the language with the best WASM support. Plotting in Rust could be very useful for visualization on a web page and would have a huge performance improvement comparing to Javascript. ## Plotting on HTML5 canvas with WASM Backend Plotters currently supports backend that uses the HTML5 canvas. To use the WASM support, you can simply use `CanvasBackend` instead of other backend and all other API remains the same! There's a small demo for Plotters + WASM under `examples/wasm-demo` directory of this repo. To play with the deployed version, follow this [link](https://plumberserver.com/plotters-wasm-demo/index.html). ## What types of figure are supported? Plotters is not limited to any specific type of figure. You can create your own types of figures easily with the Plotters API. But Plotters provides some builtin figure types for convenience. Currently, we support line series, point series, candlestick series, and histogram. And the library is designed to be able to render multiple figure into a single image. But Plotter is aimed to be a platform that is fully extendable to support any other types of figure. ## Concepts by examples ### Drawing Back-ends Plotters can use different drawing back-ends, including SVG, BitMap, and even real-time rendering. For example, a bitmap drawing backend. ```rust use plotters::prelude::*; fn main() -> Result<(), Box<dyn std::error::Error>> { // Create a 800*600 bitmap and start drawing let mut backend = BitMapBackend::new("plotters-doc-data/1.png", (300, 200)); // And if we want SVG backend // let backend = SVGBackend::new("output.svg", (800, 600)); backend.draw_rect((50, 50), (200, 150), &RED, true)?; Ok(()) } ```  ### Drawing Area Plotters uses a concept called drawing area for layout purpose. Plotters support multiple integrating into a single image. This is done by creating sub-drawing-areas. Besides that, the drawing area also allows the customized coordinate system, by doing so, the coordinate mapping is done by the drawing area automatically. ```rust use plotters::prelude::*; fn main() -> Result<(), Box<dyn std::error::Error>> { let root_drawing_area = BitMapBackend::new("plotters-doc-data/2.png", (300, 200)).into_drawing_area(); // And we can split the drawing area into 3x3 grid let child_drawing_areas = root_drawing_area.split_evenly((3, 3)); // Then we fill the drawing area with different color for (area, color) in child_drawing_areas.into_iter().zip(0..) { area.fill(&Palette99::pick(color))?; } Ok(()) } ```  ### Elements In Plotters, elements are build blocks of figures. All elements are able to draw on a drawing area. There are different types of built-in elements, like lines, texts, circles, etc. You can also define your own element in the application code. You may also combine existing elements to build a complex element. To learn more about the element system, please read the [element module documentation](./element/index.html). ```rust use plotters::prelude::*; fn main() -> Result<(), Box<dyn std::error::Error>> { let root = BitMapBackend::new("plotters-doc-data/3.png", (300, 200)).into_drawing_area(); root.fill(&WHITE)?; // Draw an circle on the drawing area root.draw(&Circle::new( (100, 100), 50, Into::<ShapeStyle>::into(&GREEN).filled(), ))?; Ok(()) } ```  ### Composable Elements Besides the built-in elements, elements can be composed into a logic group we called composed elements. When composing new elements, the upper-left corner is given in the target coordinate, and a new pixel-based coordinate which has the upper-left corner defined as `(0,0)` is used for further element composition purpose. For example, we can have an element which includes a dot and its coordinate. ```rust use plotters::prelude::*; use plotters::coord::types::RangedCoordf32; fn main() -> Result<(), Box<dyn std::error::Error>> { let root = BitMapBackend::new("plotters-doc-data/4.png", (640, 480)).into_drawing_area(); root.fill(&RGBColor(240, 200, 200))?; let root = root.apply_coord_spec(Cartesian2d::<RangedCoordf32, RangedCoordf32>::new( 0f32..1f32, 0f32..1f32, (0..640, 0..480), )); let dot_and_label = |x: f32, y: f32| { return EmptyElement::at((x, y)) + Circle::new((0, 0), 3, ShapeStyle::from(&BLACK).filled()) + Text::new( format!("({:.2},{:.2})", x, y), (10, 0), ("sans-serif", 15.0).into_font(), ); }; root.draw(&dot_and_label(0.5, 0.6))?; root.draw(&dot_and_label(0.25, 0.33))?; root.draw(&dot_and_label(0.8, 0.8))?; Ok(()) } ``` 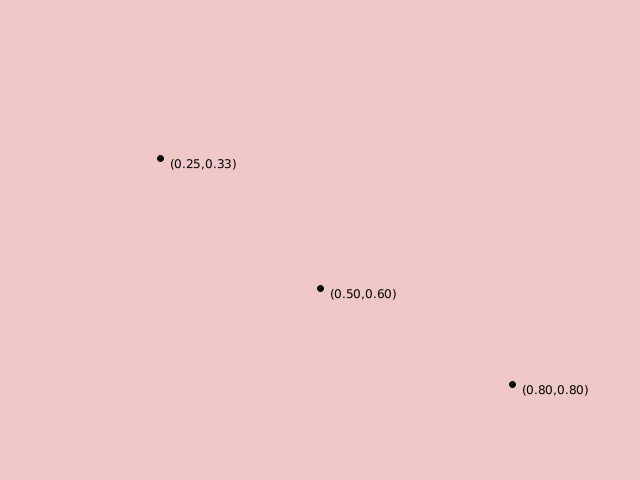 ### Chart Context In order to draw a chart, Plotters need a data object built on top of the drawing area called `ChartContext`. The chart context defines even higher level constructs compare to the drawing area. For example, you can define the label areas, meshes, and put a data series onto the drawing area with the help of the chart context object. ```rust use plotters::prelude::*; fn main() -> Result<(), Box<dyn std::error::Error>> { let root = BitMapBackend::new("plotters-doc-data/5.png", (640, 480)).into_drawing_area(); root.fill(&WHITE); let root = root.margin(10, 10, 10, 10); // After this point, we should be able to draw construct a chart context let mut chart = ChartBuilder::on(&root) // Set the caption of the chart .caption("This is our first plot", ("sans-serif", 40).into_font()) // Set the size of the label region .x_label_area_size(20) .y_label_area_size(40) // Finally attach a coordinate on the drawing area and make a chart context .build_cartesian_2d(0f32..10f32, 0f32..10f32)?; // Then we can draw a mesh chart .configure_mesh() // We can customize the maximum number of labels allowed for each axis .x_labels(5) .y_labels(5) // We can also change the format of the label text .y_label_formatter(&|x| format!("{:.3}", x)) .draw()?; // And we can draw something in the drawing area chart.draw_series(LineSeries::new( vec![(0.0, 0.0), (5.0, 5.0), (8.0, 7.0)], &RED, ))?; // Similarly, we can draw point series chart.draw_series(PointSeries::of_element( vec![(0.0, 0.0), (5.0, 5.0), (8.0, 7.0)], 5, &RED, &|c, s, st| { return EmptyElement::at(c) // We want to construct a composed element on-the-fly + Circle::new((0,0),s,st.filled()) // At this point, the new pixel coordinate is established + Text::new(format!("{:?}", c), (10, 0), ("sans-serif", 10).into_font()); }, ))?; Ok(()) } ``` 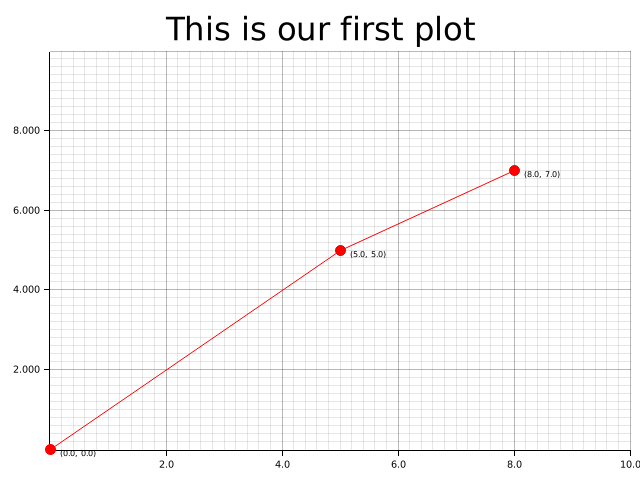 ## Misc ### Development Version To use the latest development version, pull https://github.com/38/plotters.git. In `Cargo.toml` ```toml [dependencies] plotters = { git = "https://github.com/38/plotters.git" } ``` ### Reducing Depending Libraries && Turning Off Backends Plotters now supports use features to control the backend dependencies. By default, `BitMapBackend` and `SVGBackend` are supported, use `default_features = false` in the dependency description in `Cargo.toml` and you can cherry-pick the backend implementations. - `svg` Enable the `SVGBackend` - `bitmap` Enable the `BitMapBackend` For example, the following dependency description would avoid compiling with bitmap support: ```toml [dependencies] plotters = { git = "https://github.com/38/plotters.git", default_features = false, features = ["svg"] } ``` The library also allows consumers to make use of the [`Palette`](https://crates.io/crates/palette/) crate's color types by default. This behavior can also be turned off by setting `default_features = false`. ### List of Features This is the full list of features that is defined by `Plotters` crate. Use `default_features = false` to disable those default enabled features, and then you should be able to cherry-pick what features you want to include into `Plotters` crate. By doing so, you can minimize the number of dependencies down to only `itertools` and compile time is less than 6s. The following list is a complete list of features that can be opt in and out. - Tier 1 drawing backends | Name | Description | Additional Dependency |Default?| |---------|--------------|--------|------------| | bitmap\_encoder | Allow `BitMapBackend` save the result to bitmap files | image, rusttype, font-kit | Yes | | svg\_backend | Enable `SVGBackend` Support | None | Yes | | bitmap\_gif| Opt-in GIF animation Rendering support for `BitMapBackend`, implies `bitmap` enabled | gif | Yes | - Font manipulation features | Name | Description | Additional Dependency |Default?| |---------|--------------|--------|------------| | ttf | Allows TrueType font support | rusttype, font-kit | Yes | - Coordinate features | Name | Description | Additional Dependency |Default?| |---------|--------------|--------|------------| | datetime | Eanble the date and time coordinate support | chrono | Yes | - Element, series and util functions | Name | Description | Additional Dependency |Default?| |---------|--------------|--------|------------| | errorbar | The errorbar element support | None | Yes | | candlestick | The candlestick element support | None | Yes | | boxplot | The boxplot element support | None | Yes | | area\_series | The area series support | None | Yes | | line\_series | The line series support | None | Yes | | histogram | The histogram series support | None | Yes | | point\_series| The point series support | None | Yes | - Misc | Name | Description | Additional Dependency |Default?| |---------|--------------|--------|------------| | deprecated\_items | This feature allows use of deprecated items which is going to be removed in the future | None | Yes | | debug | Enable the code used for debugging | None | No | ## FAQ List * Why does the WASM example break on my machine ? The WASM example requires using `wasm32` target to build. Using `cargo build` is likely to use the default target which in most of the case is any of the x86 target. Thus you need add `--target=wasm32-unknown-unknown` in the cargo parameter list to build it. * How to draw text/circle/point/rectangle/... on the top of chart ? As you may realized, Plotters is a drawing library rather than a traditional data plotting library, you have the freedom to draw anything you want on the drawing area. Use `DrawingArea::draw` to draw any element on the drawing area. * Where can I find the backend code ? Since Plotters 0.3, all drawing backends are independent crate from the main Plotters crate. Use the following link to find the backend code: - [Bitmap Backend](https://github.com/plotters-rs/plotters-bitmap.git) - [SVG Backend](https://github.com/plotters-rs/plotters-svg.git) - [HTML5 Canvas Backend](https://github.com/plotters-rs/plotters-canvas.git) - [GTK/Cairo Backend](https://github.com/plotters-rs/plotters-cairo.git) <style> img { display: block; margin: 0 auto; max-width: 500px; } .galleryItem { width: 250px; display: inline-block; } .galleryImg { max-width: 100%; } .galleryText { text-align: center; } </style> */ pub mod chart; pub mod coord; pub mod data; pub mod drawing; pub mod element; pub mod series; pub mod style; #[cfg(feature = "evcxr")] pub mod evcxr; #[cfg(test)] pub use crate::drawing::{check_color, create_mocked_drawing_area}; #[cfg(feature = "palette_ext")] pub use palette; /// The module imports the most commonly used types and modules in Plotters pub mod prelude { // Chart related types pub use crate::chart::{ChartBuilder, ChartContext, LabelAreaPosition, SeriesLabelPosition}; // Coordinates pub use crate::coord::{ cartesian::Cartesian2d, combinators::{ make_partial_axis, BindKeyPointMethod, BindKeyPoints, BuildNestedCoord, GroupBy, IntoLinspace, IntoLogRange, IntoPartialAxis, Linspace, LogCoord, LogScalable, NestedRange, NestedValue, ToGroupByRange, }, ranged1d::{DiscreteRanged, IntoSegmentedCoord, Ranged, SegmentValue}, CoordTranslate, }; #[allow(deprecated)] pub use crate::coord::combinators::LogRange; #[cfg(feature = "chrono")] pub use crate::coord::types::{ IntoMonthly, IntoYearly, RangedDate, RangedDateTime, RangedDuration, }; // Re-export the backend for backward compatibility pub use plotters_backend::DrawingBackend; pub use crate::drawing::*; // Series helpers #[cfg(feature = "area_series")] pub use crate::series::AreaSeries; #[cfg(feature = "histogram")] pub use crate::series::Histogram; #[cfg(feature = "line_series")] pub use crate::series::LineSeries; #[cfg(feature = "point_series")] pub use crate::series::PointSeries; #[cfg(feature = "surface_series")] pub use crate::series::SurfaceSeries; // Styles pub use crate::style::{ AsRelative, Color, FontDesc, FontFamily, FontStyle, FontTransform, HSLColor, IntoFont, IntoTextStyle, Palette, Palette100, Palette99, Palette9999, PaletteColor, RGBColor, ShapeStyle, TextStyle, }; pub use crate::style::{BLACK, BLUE, CYAN, GREEN, MAGENTA, RED, TRANSPARENT, WHITE, YELLOW}; // Elements pub use crate::element::{ Circle, Cross, Cubiod, DynElement, EmptyElement, IntoDynElement, MultiLineText, PathElement, Pixel, Polygon, Rectangle, Text, TriangleMarker, }; #[cfg(feature = "boxplot")] pub use crate::element::Boxplot; #[cfg(feature = "candlestick")] pub use crate::element::CandleStick; #[cfg(feature = "errorbar")] pub use crate::element::ErrorBar; #[cfg(feature = "bitmap_backend")] pub use crate::element::BitMapElement; // Data pub use crate::data::Quartiles; // TODO: This should be deprecated and completely removed #[cfg(feature = "deprecated_items")] #[allow(deprecated)] pub use crate::element::Path; #[allow(type_alias_bounds)] /// The type used to returns a drawing operation that can be failed /// - `T`: The return type /// - `D`: The drawing backend type pub type DrawResult<T, D: DrawingBackend> = Result<T, crate::drawing::DrawingAreaErrorKind<D::ErrorType>>; #[cfg(feature = "evcxr")] pub use crate::evcxr::evcxr_figure; // Re-export tier 1 backends for backward compatibility #[cfg(feature = "bitmap_backend")] pub use plotters_bitmap::BitMapBackend; #[cfg(feature = "svg_backend")] pub use plotters_svg::SVGBackend; }