Crate pretty_trace[−][src]
This crate provide tools for generating pretty tracebacks and for profiling.
Pretty tracebacks
Stack traces (or “tracebacks”) are a fundamental vehicle for describing what code is doing at a given instant. A beautiful thing about rust is that crashes nearly always yield tracebacks, and those tracebacks nearly always extend all the way from the ‘broken’ code line all the way to the main program. We may take these properties for granted but in general neither is true for other languages, including C++.
However, as in other languages, native rust tracebacks are verbose. A major goal of this crate is to provide succinct and readable “pretty” tracebacks, in place of the native tracebacks. These pretty traces can be ten times shorter than native tracebacks. In addition, unlike rust native tracebacks, pretty traces are obtained without setting an environment variable.
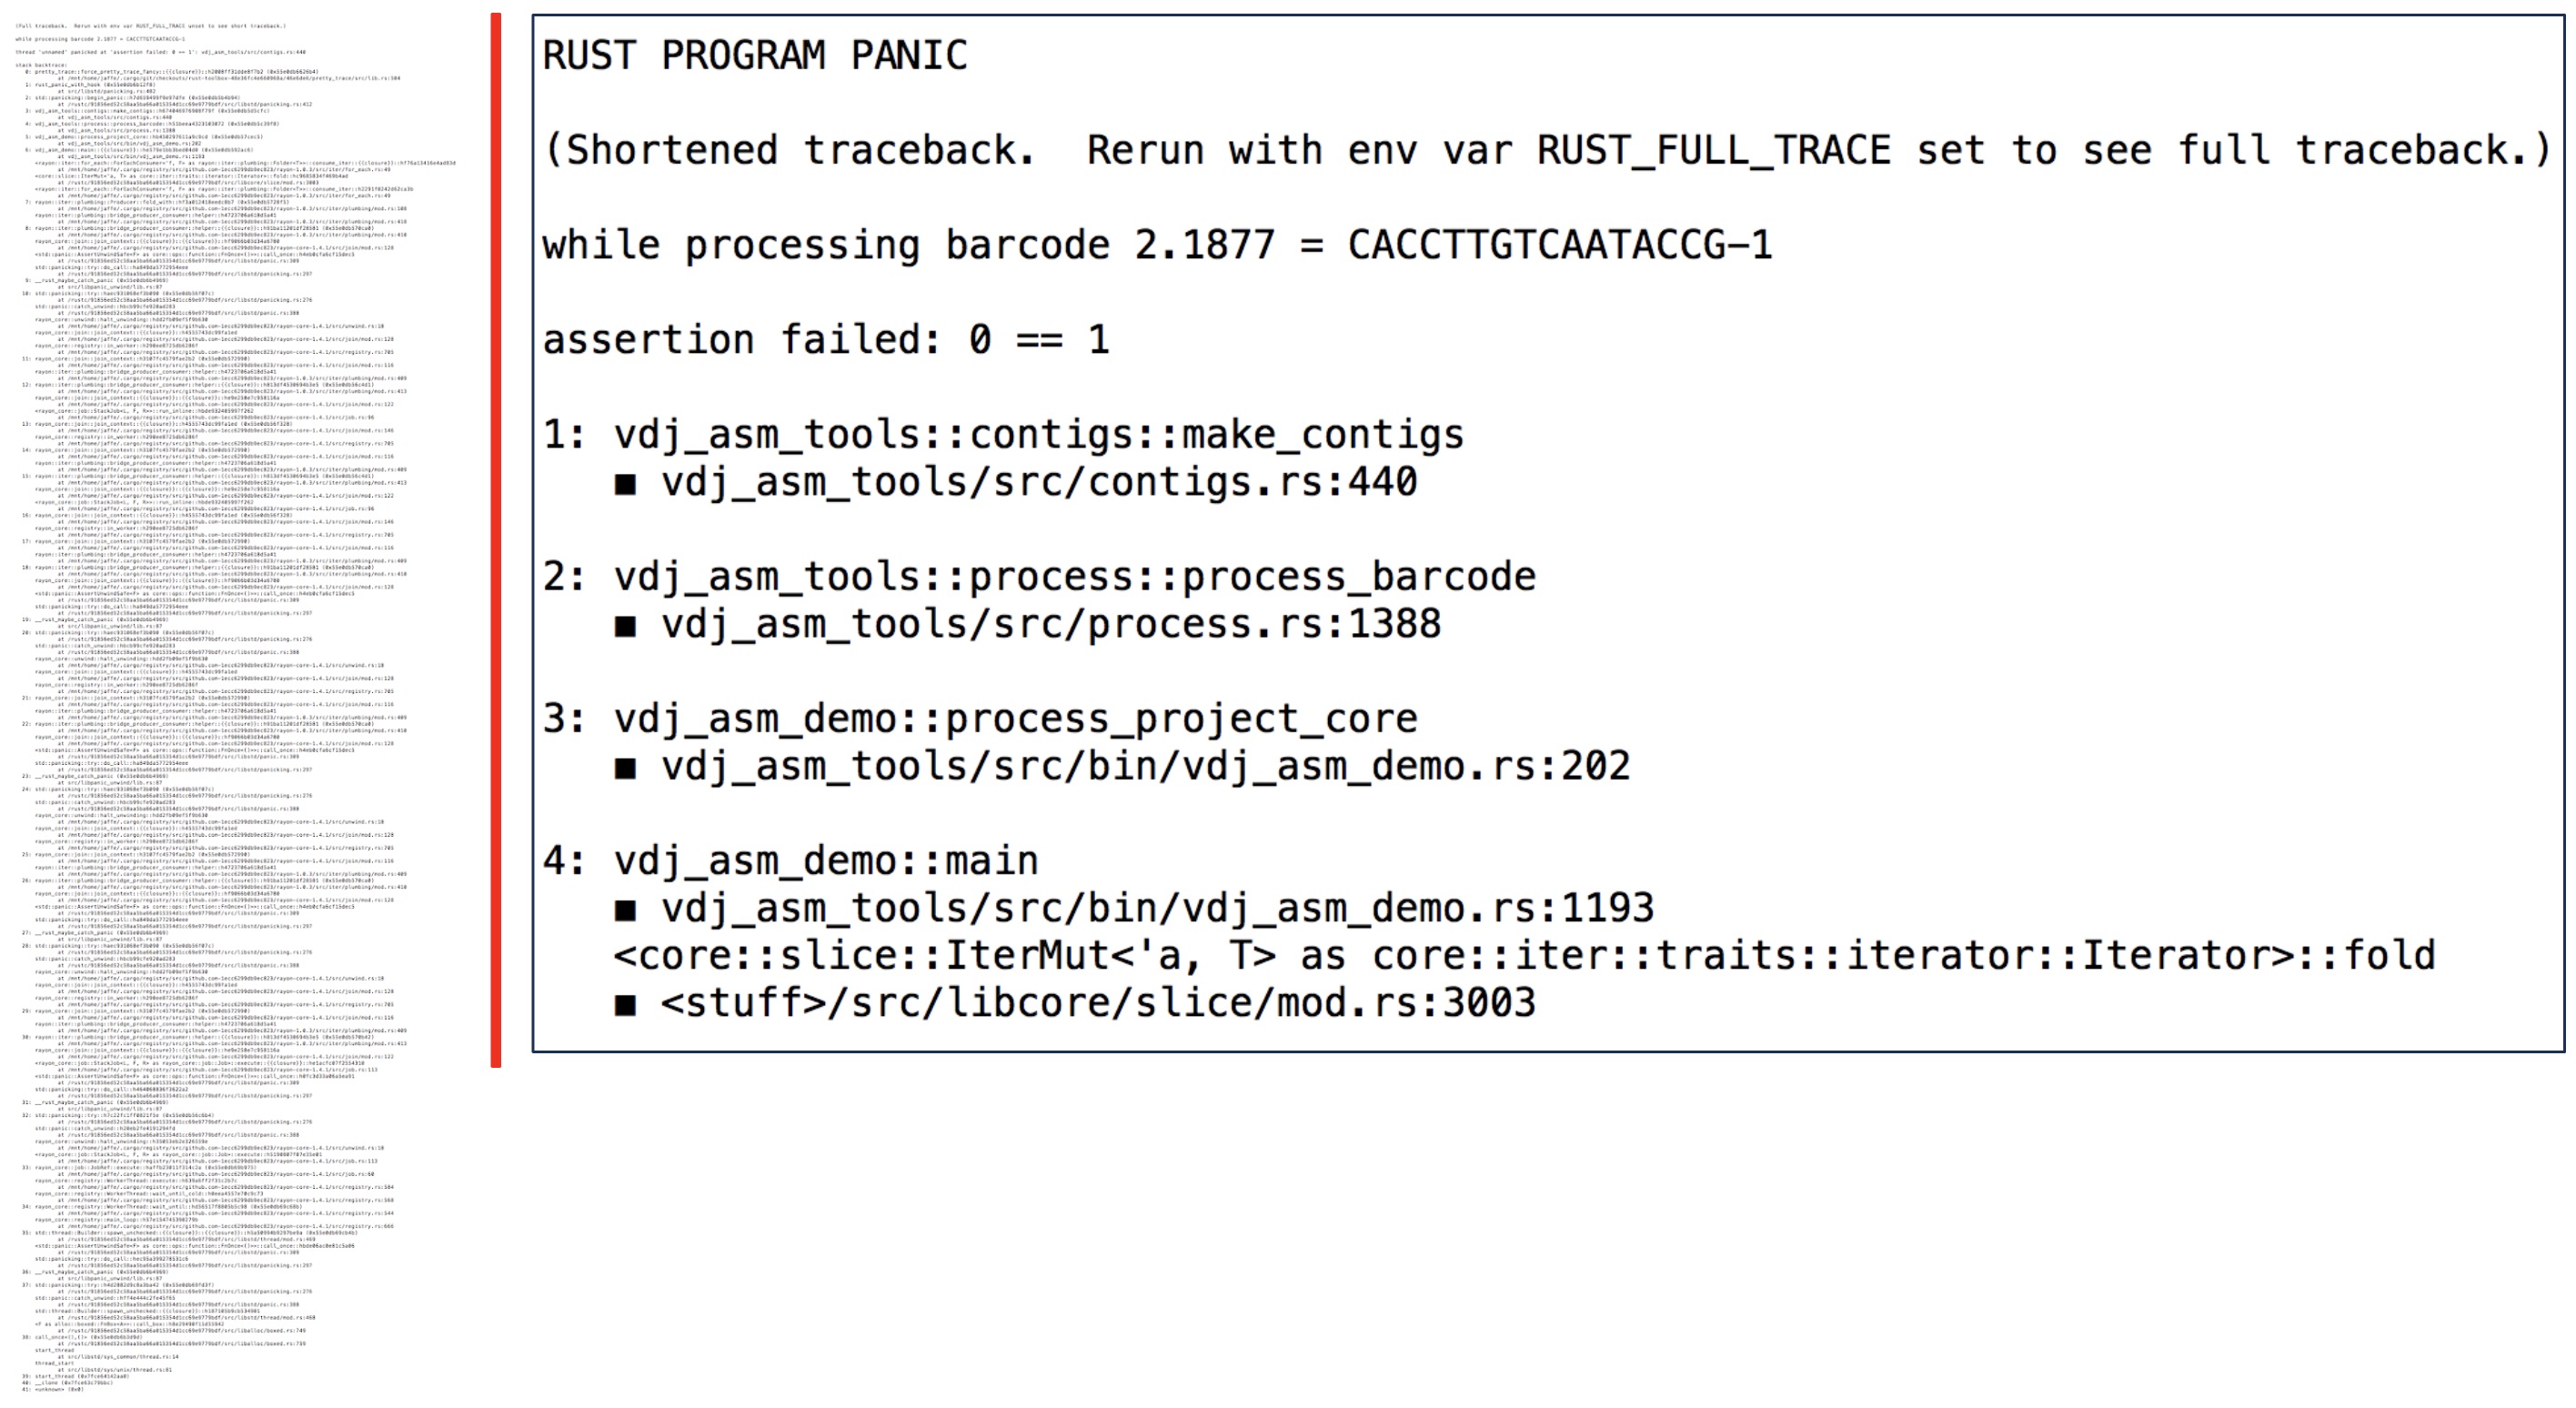
Example of native versus pretty trace output
Profiling
Profiling is a fundamental tool for optimizing code. Standard profiling tools including perf are powerful, however they can be challenging to use. This crate provides a profiling capability that is completely trivial to invoke and interpret, and yields a tiny file as output.
The idea is very simple: if it is possible to significantly speed up your code, this should be directly visible from a modest sample of tracebacks chosen at random. And these tracebacks can be generated for any main program by adding a simple command-line option to it that causes it to enter a special ‘profile’ mode, gathering tracebacks and then terminating.
For example this command-line option might be
PROF=100 to profile 100 events. It’s your choice how to specify
this command-line option, but this crate makes it trivial to do so.
With about one minute’s work,
you can make it possible to profile your code with essentially zero work,
whenever you like.
Example of pretty trace profiling output
PRETTY TRACE PROFILE
TRACED = 81.3%
TOTAL = 100
[1] COUNT = 13
1: vdj_asm_tools::contigs::make_contigs
◼ vdj_asm_tools/src/contigs.rs:494
2: vdj_asm_tools::process::process_barcode
◼ vdj_asm_tools/src/process.rs:1388
3: vdj_asm_demo::process_project_core
◼ vdj_asm_tools/src/bin/vdj_asm_demo.rs:202
4: vdj_asm_demo::main
◼ vdj_asm_tools/src/bin/vdj_asm_demo.rs:890
vdj_asm_demo::main
◼ vdj_asm_tools/src/bin/vdj_asm_demo.rs:854
[2] COUNT = 6
1: tenkit2::hyper::Hyper::build_from_reads
◼ tenkit2/src/hyper.rs:325
2: vdj_asm_tools::process::process_barcode
◼ vdj_asm_tools/src/process.rs:851
3: vdj_asm_demo::process_project_core
◼ vdj_asm_tools/src/bin/vdj_asm_demo.rs:202
4: vdj_asm_demo::main
◼ vdj_asm_tools/src/bin/vdj_asm_demo.rs:890
vdj_asm_demo::main
◼ vdj_asm_tools/src/bin/vdj_asm_demo.rs:854
...
Here pretty trace profiling reveals exactly what some code was doing at 100 random instances; we show the first 19 of 100 collated tracebacks. More were attempted: of attempted tracebacks, 81.3% were successful. Most fails are due to cases where the stack trace would have ‘walked’ into the allocator, as discussed at “Full Disclosure” below.
A brief guide for using pretty trace
First make sure that you have rust debug on: if you’re using release mode, add these lines
[profile.release]
debug = true
to your top-level Cargo.toml. This adds debugging info to executables, thus
enabling meaningful tracebacks (whether or not you use pretty_trace). It will
increase the size of executables. It might also increase run time, but probably not by much.
Now to access pretty trace, put this in your Cargo.toml
pretty_trace = {git = "https://github.com/10XGenomics/rust-toolbox.git"}
and this
use pretty_trace::*;
in your main program.
Next to turn on pretty traces, it is enough to insert this
PrettyTrace::new().on();
at the beginning of your main program. And you’re good to go! Any panic will cause a pretty traceback to be generated.
To instead profile, e.g. for 100 events, do this
PrettyTrace::new().profile(100).on();
Several other useful features are described below. This include the capability of tracing to know where you are in your data (and not just your code), and for focusing profiling on a key set of crates that you’re optimizing.
Credit
This code was developed at 10x Genomics, and is based in part on C++ code developed at the Whitehead Institute Center for Genome Research / Broad Institute starting in 2000, and included in https://github.com/CompRD/BroadCRD.
FAQ
1. Could a pretty traceback lose important information?
Possibly. For this reason we provide the capability of dumping a full
traceback to a file (as ‘insurance’) and also an environment variable to
force full tracebacks. However we have not seen examples where important
information is lost.
2. Can the pretty traceback itself be saved to a separate file?
Yes this capability is provided.
3. Can I get a traceback on Ctrl-C?
Yes, if you do this
PrettyTrace::new().ctrlc().on();
then any Ctrl-C will be converted into a panic, and then you’ll get a trackback.
Full disclosure
◼ The code has only been confirmed to work under linux. The code has been used under OS X, but tracebacks can be incomplete. An example is provided of this behavior.
◼ The code will only work properly if you have set debug = true
in your top-level Cargo.toml. Using debug = 1
will not work.
◼ Profile mode only sees the main thread. This seems intrinsic to the approach. So you may need to modify your code to run single-threaded to effectively use this mode.
◼ Profile mode yields no output if your program exits before obtaining the requested number of stack traces.
◼ Profile mode does not yield a stack trace if the code is executing inside the allocator. In our test cases this is around 15% of the time.
◼ Profile mode tests for whether it is inside the allocator by comparing to a fixed
list of symbols such as _int_free. This list could be incomplete,
or could become incomplete. When it is incomplete, typically what you’ll see is that
the profiling process is killed. Generally what is missing from the list can be
determined by setting haps_debug(), and looking at the trace right before
the process was killed. Under development, this was needed once over a one year period.
However, subsequently we have found instances where the process is killed, and we have
been unable to determine the cause.
◼ Ideally out-of-memory events would be caught and converted to panics so we could trace them, but we don’t. This is a general rust problem that no one has figured out how to solve. See issue 43596 and internals 3673.
◼ The code parses the output of a formatted stack trace, rather then generating output directly from a formal stack trace structure (which it should do). This makes it vulnerable to changes in stack trace formatting.
◼ There is an ugly blacklist of strings that is fragile. This may be an intrinsic feature of the approach.
More
See the documentation for PrettyTrace, linked to below.
Structs
| CHashMap | Super simplifed concurrent HashMap for use with pretty_trace. The only public method is
|
| PrettyTrace | A |
Functions
| new_thread_message | See |