mprober 0.10.0

This program aims to collect Linux system information including hostname, kernel version, uptime, RTC time, load average, CPU, memory, network interfaces and block devices. It can be used not only as a normal CLI tool, but also a web application with a front-end webpage and useful HTTP APIs.
Documentation

M Prober

Build Status

This program aims to collect Linux system information including hostname, kernel version, uptime, RTC time, load average, CPU, memory, network interfaces and block devices. It can be used not only as a normal CLI tool, but also a web application with a front-end webpage and useful HTTP APIs.

Help

EXAMPLES:
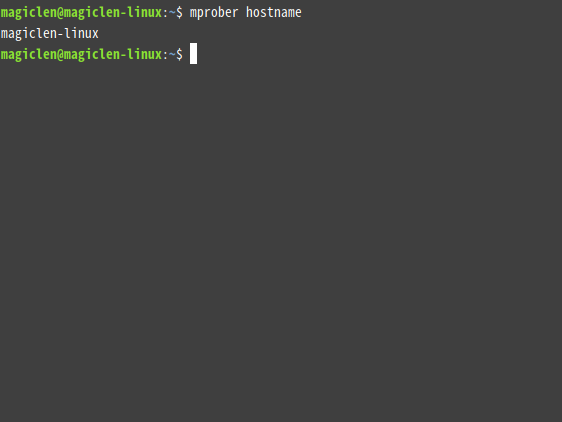
  mprober hostname                    # Show the hostname
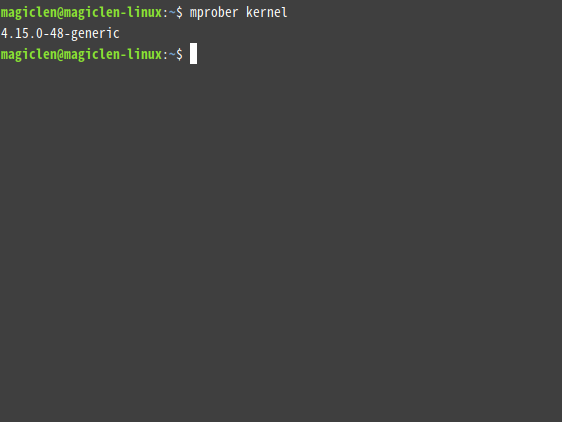
  mprober kernel                      # Show the kernel version
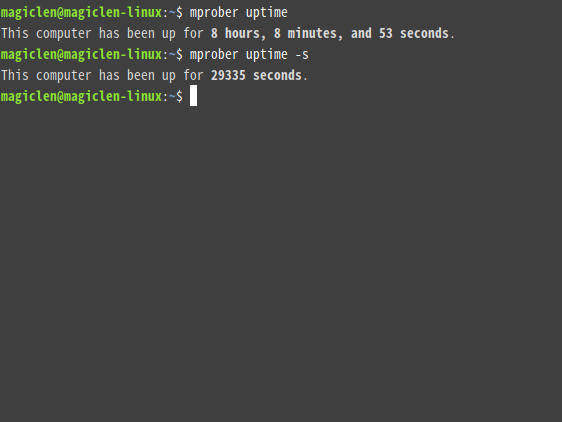
  mprober uptime                      # Show the uptime
  mprober uptime -m                   # Show the uptime and refresh every second
  mprober uptime -p                   # Show the uptime without colors
  mprober uptime -l                   # Show the uptime with darker colors (fitting in with light themes)
  mprober uptime -s                   # Show the uptime in seconds
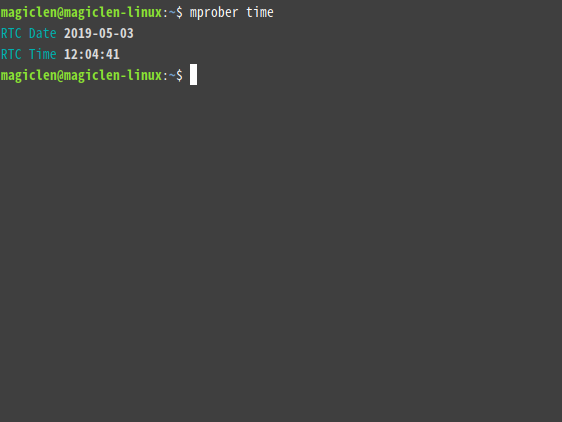
  mprober time                        # Show the RTC (UTC) date and time
  mprober time -m                     # Show the RTC (UTC) date and time and refresh every second
  mprober time -p                     # Show the RTC (UTC) date and time without colors
  mprober time -l                     # Show the RTC (UTC) date and time with darker colors (fitting in with light themes)
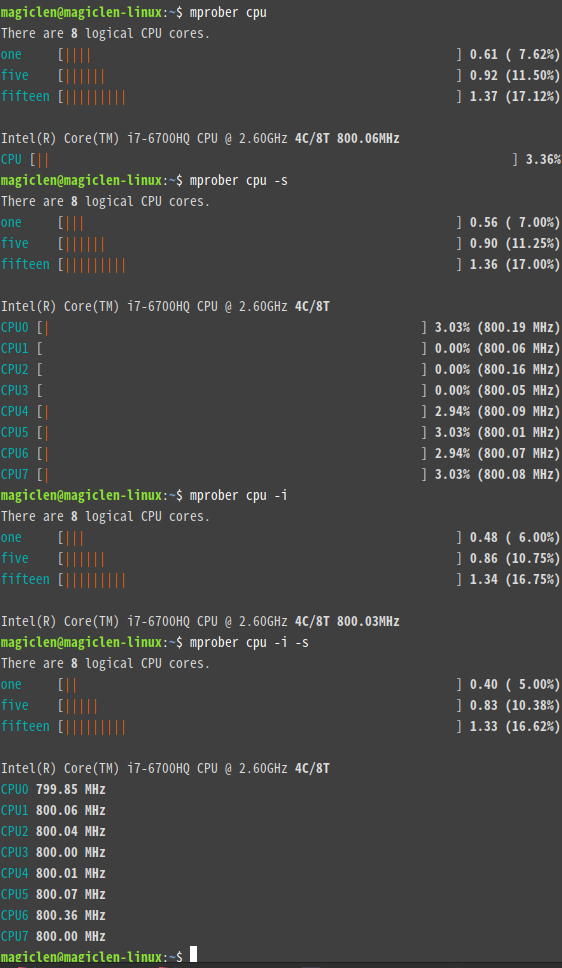
  mprober cpu                         # Show load average and current CPU stats on average
  mprober cpu -m 1000                 # Show load average and CPU stats on average and refresh every 1000 milliseconds
  mprober cpu -p                      # Show load average and current CPU stats on average without colors
  mprober cpu -l                      # Show load average and current CPU stats on average with darker colors (fitting in with light themes)
  mprober cpu -s                      # Show load average and current stats of CPU cores separately
  mprober cpu -i                      # Only show CPU information
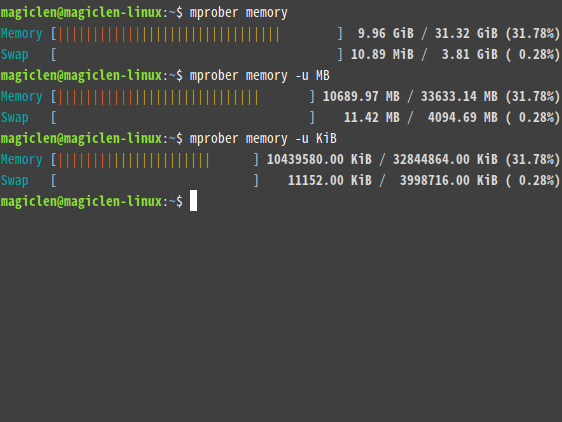
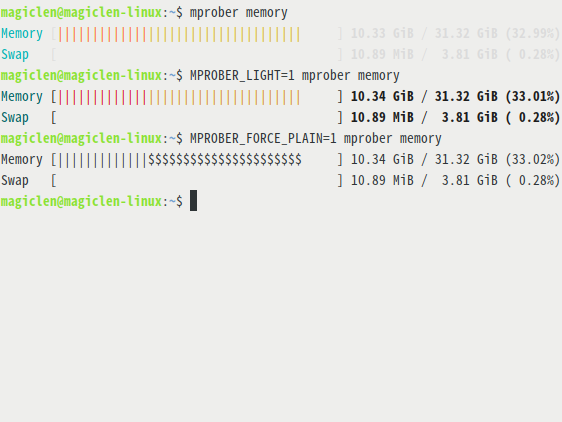
  mprober memory                      # Show current memory stats
  mprober memory -m 1000              # Show memory stats and refresh every 1000 milliseconds
  mprober memory -p                   # Show current memory stats without colors
  mprober memory -l                   # Show current memory stats with darker colors (fitting in with light themes)
  mprober memory -u kb                # Show current memory stats in KB
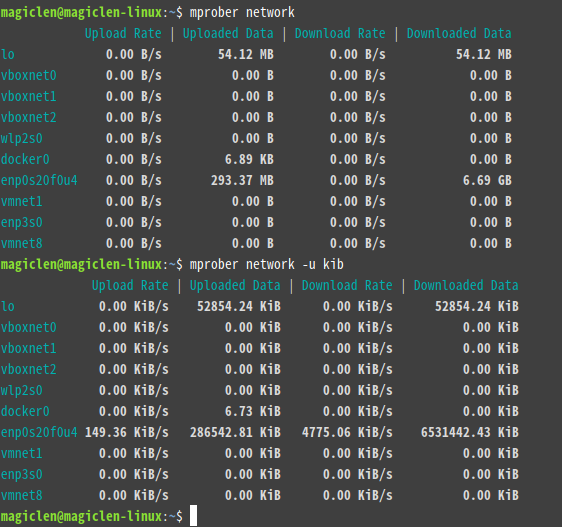
  mprober network                     # Show current network stats
  mprober network -m 1000             # Show network stats and refresh every 1000 milliseconds
  mprober network -p                  # Show current network stats without colors
  mprober network -l                  # Show current network stats with darker colors (fitting in with light themes)
  mprober network -u kb               # Show current network stats in KB
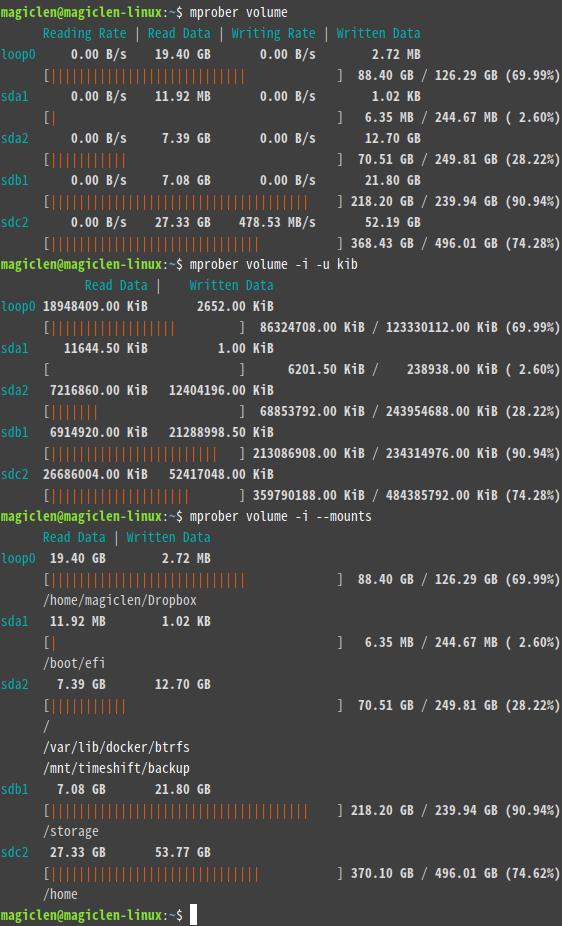
  mprober volume                      # Show current volume stats
  mprober volume -m 1000              # Show current volume stats and refresh every 1000 milliseconds
  mprober volume -p                   # Show current volume stats without colors
  mprober volume -l                   # Show current volume stats without colors
  mprober volume -u kb                # Show current volume stats in KB
  mprober volume -i                   # Only show volume information without I/O rates
  mprober volume --mounts             # Show current volume stats including mount points
  mprober web                         # Start a HTTP service on port 8000 to monitor this computer. The default time interval is 3 seconds
  mprober web -m 2                    # Start a HTTP service on port 8000 to monitor this computer. The time interval is set to 2 seconds
  mprober web -p 7777                 # Start a HTTP service on port 7777 to monitor this computer
  mprober web -a auth_key             # Start a HTTP service on port 8000 to monitor this computer. APIs need to be invoked with an auth key
  mprober web --only-api              # Start a HTTP service on port 8000 to serve only HTTP APIs
  mprober benchmark                   # Run benchmarks
  mprober benchmark --disable-cpu     # Run benchmarks except for benchmarking CPU
  mprober benchmark --enable-memory   # Benchmark the memory

USAGE:
    mprober [SUBCOMMAND]

FLAGS:
    -h, --help       Prints help information
    -V, --version    Prints version information

SUBCOMMANDS:
    hostname     Shows the hostname
    kernel       Shows the kernel version
    uptime       Shows the uptime
    time         Shows the RTC (UTC) date and time
    cpu          Shows CPU stats
    memory       Shows memory stats
    network      Shows network stats
    volume       Shows volume stats
    web          Starts a HTTP service to monitor this computer
    benchmark    Runs benchmarks to measure the performance of this environment
    help         Prints this message or the help of the given subcommand(s)

Requirements

  • Linux Kernel Version: 3.10+

Usage

Installation / Uninstallation

From crates.io,

cargo install mprober

# cargo uninstall mprober

From GitHub (x86 and x86_64),

(curl -s https://api.github.com/repos/magiclen/m-prober/releases/latest | sed -r -n 's/.*"browser_download_url": *"(.*\/mprober_'$(uname -m)')".*/\1/p' | wget -i -) && sudo mv mprober_$(uname -m) /usr/local/bin/mprober && sudo chmod +x /usr/local/bin/mprober

# sudo rm /usr/local/bin/mprober

CLI

Get Hostname
mprober hostname

In addition to hostname, h, host, name, and servername are also acceptable.

hostname.png

Get Kernel Version
mprober kernel

In addition to kernel, k, l, and linux are also acceptable.

kernel.png

Get System Uptime
mprober uptime

In addition to uptime, u, up, utime, and ut are also acceptable.

uptime.png

Get RTC Time
mprober time

In addition to time, t, systime, stime, st, utc, utctime, rtc, rtctime, and date are also acceptable.

time.png

Show CPU Stats
mprober cpu

In addition to cpu, c, cpus, core, cores, load, processor, and processors are also acceptable.

cpu.png

Show Memory Stats
mprober memory

In addition to memory, m, mem, f,free, memories, swap, ram, dram, ddr, cache, buffer, buffers, buf, and buff are also acceptable.

memory.png

Show Network Stats
mprober network

In addition to network, n, net, networks,bandwidth, and traffic are also acceptable.

network.png

Show Volume Stats
mprober volume

In addition to volume, v, storage, volumes, d, disk, disks, blk, block, blocks, mount, mounts, ssd, and hdd are also acceptable.

volume.png

Color Mode

Environment variables, MPROBER_LIGHT and MPROBER_FORCE_PLAIN can be used to control the output colors.
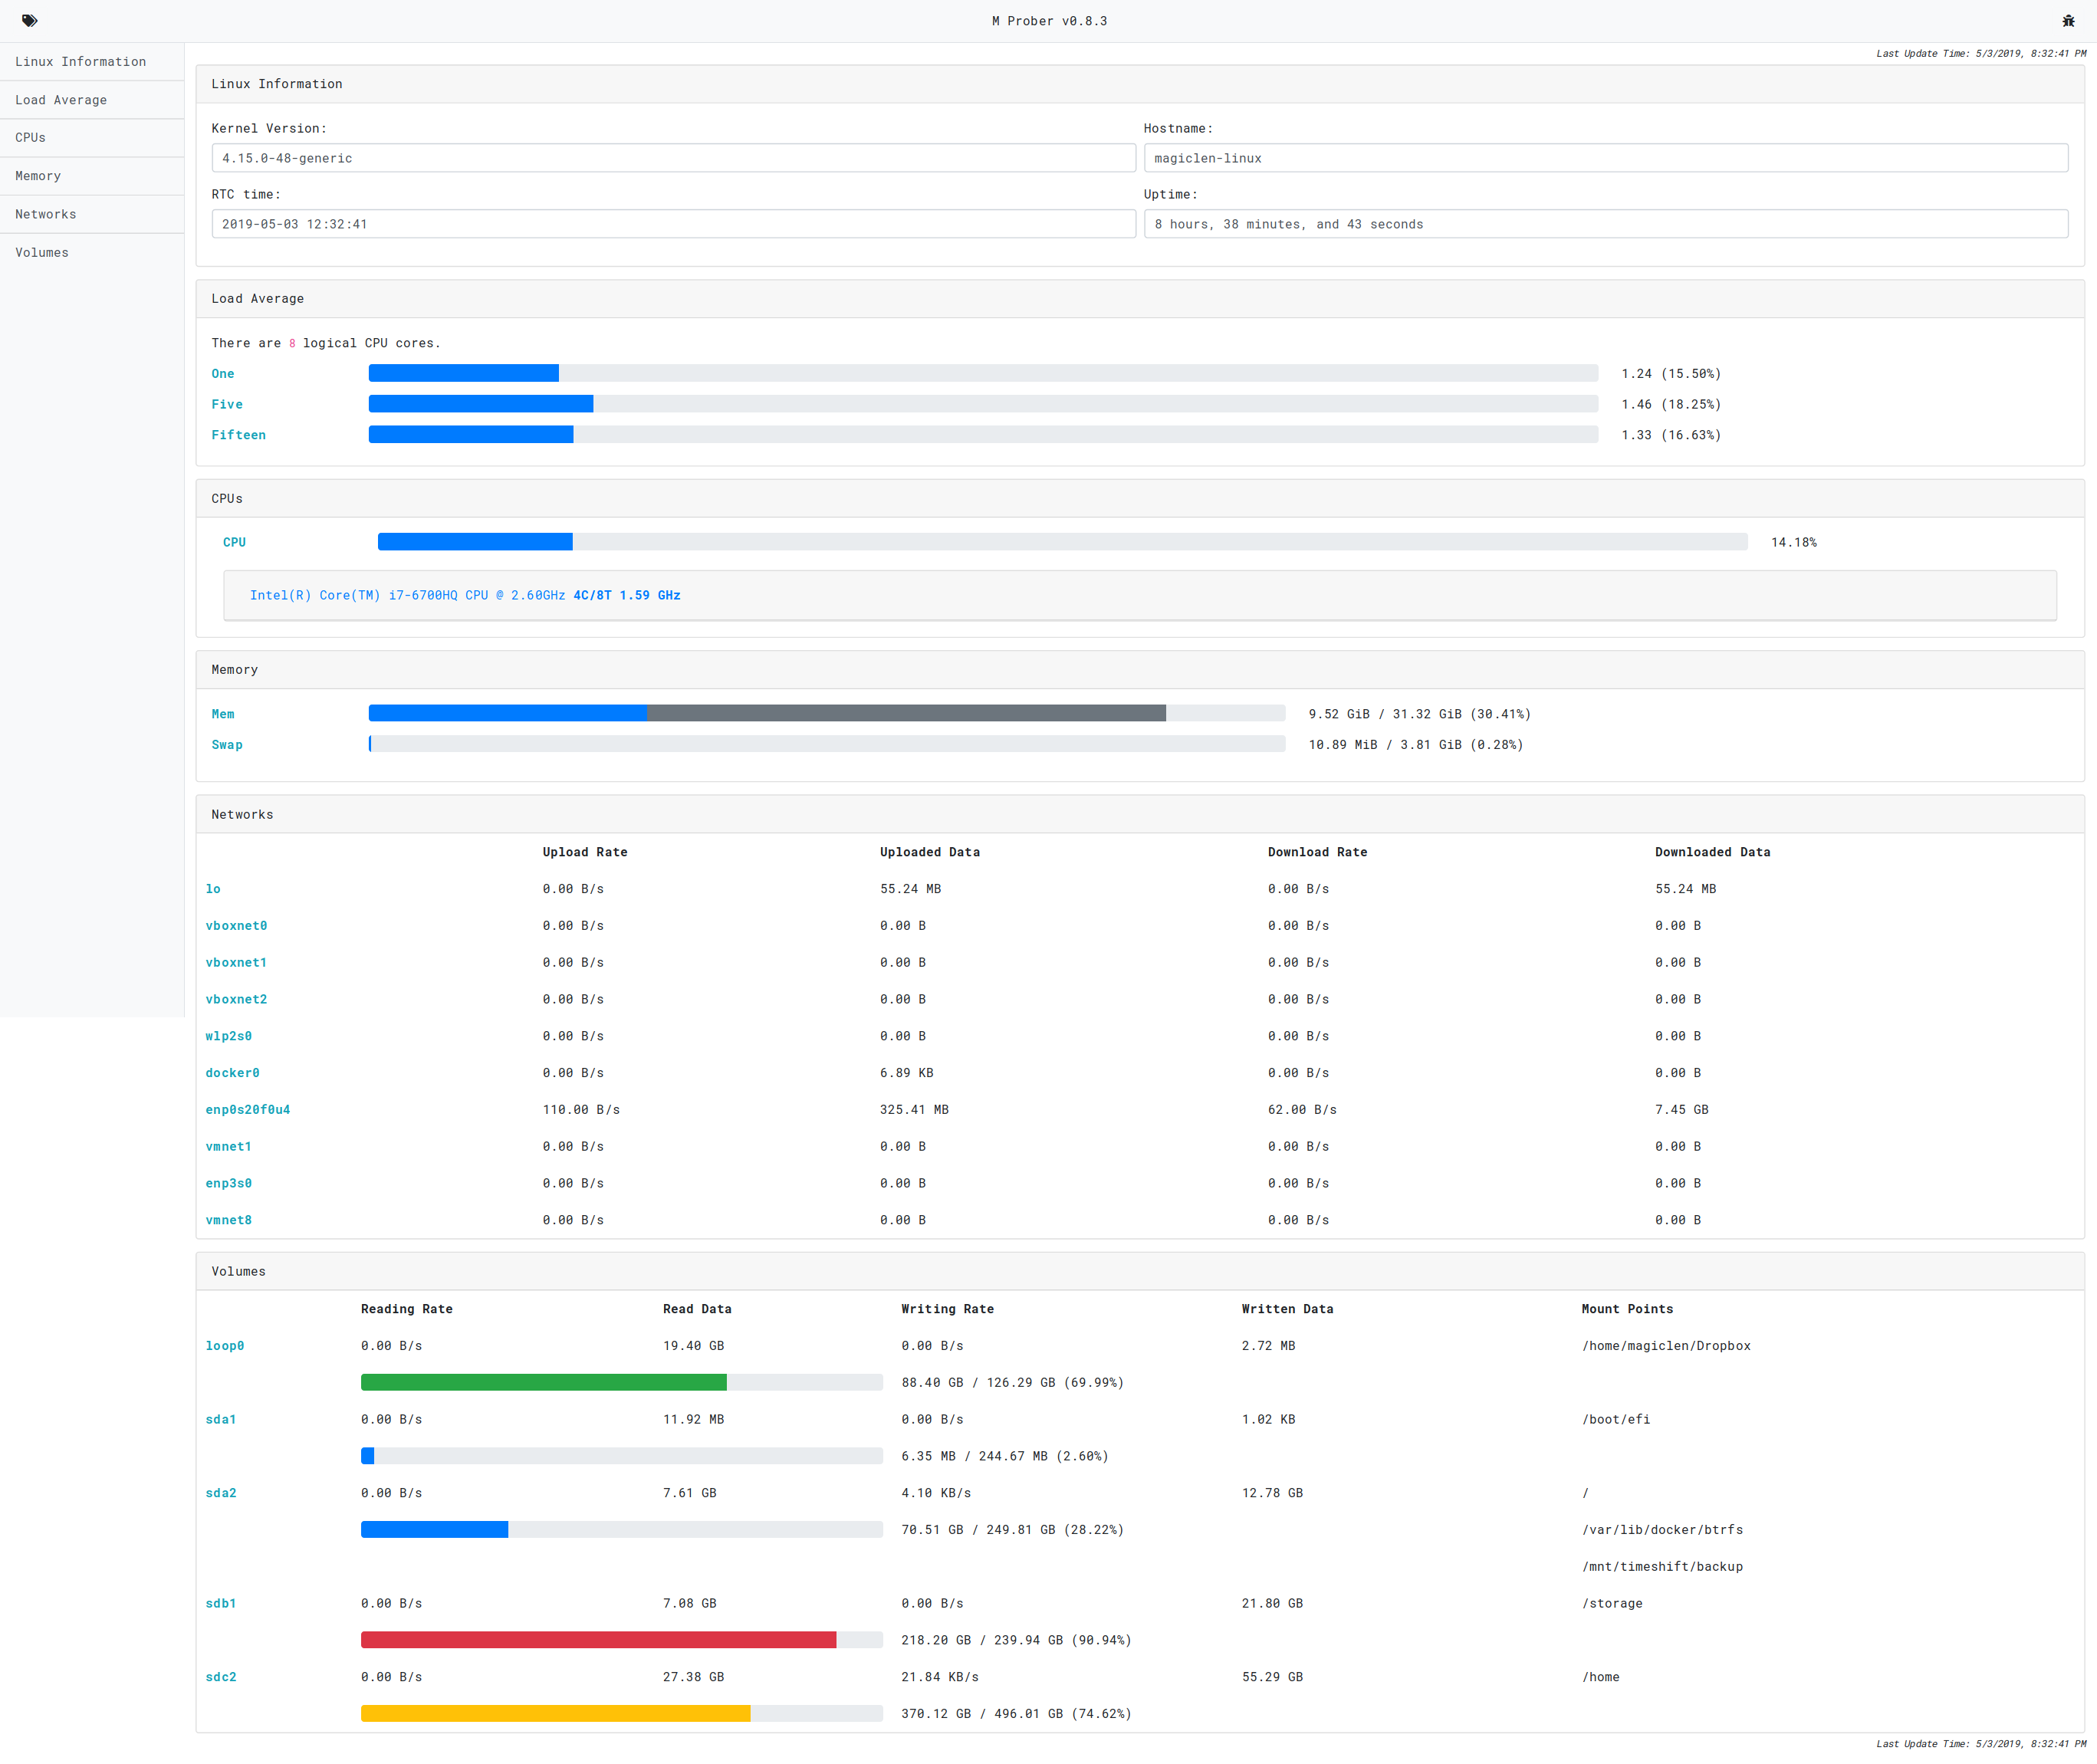
colors.png

Web (HTTP)

Launching the Server

mprober web

In addition to web, w, server, and http are also acceptable.

Once you start the server, you can open http://0.0.0.0:8000 via a web browser such as Firefox or Chrome.

web.png

To change the listening port, use the -p <port> option. To change the detecting time interval, use the -m <SECONDS> option, where the <SECONDS> is ranged from 1 to 15.
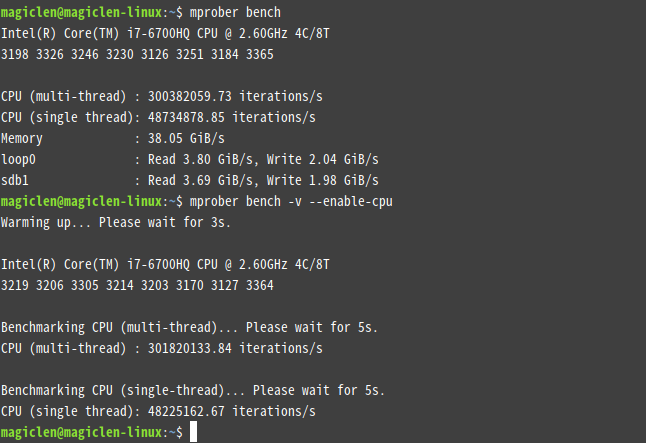
Benchmark

To benchmark the performance of CPU, memory and volumes,

mprober benchmark

In addition to benchmark, b, bench, and performance are also acceptable.

Adding the --disable-xxx or --enable-xxx flags can control what benchmarks you want to run.

web.png

HTTP APIs

GET /api/hostname
{
    "code": 0,
    "data": "magiclen-linux"
}
GET /api/kernel
{
    "code": 0,
    "data": "4.15.0-48-generic"
}
GET /api/uptime
{
    "code": 0,
    "data": 31694
}

The unit of data is seconds.

GET /api/time
{
    "code": 0,
    "data": {
        "date": "2019-05-03",
        "time": "12:43:14"
    }
}

It's RTC time.

GET /api/cpu
{
    "code": 0,
    "data": {
        "cpus": [
            {
                "cores": 4,
                "mhz": [
                    2571.96,
                    2688.208,
                    2604.095,
                    2700.238,
                    2700.034,
                    2699.908,
                    2700.329,
                    2699.986
                ],
                "model_name": "Intel(R) Core(TM) i7-6700HQ CPU @ 2.60GHz",
                "threads": 8
            }
        ],
        "load_average": {
            "fifteen": 1.02,
            "five": 0.83,
            "one": 0.61
        }
    }
}
GET /api/cpu-detect
{
    "code": 0,
    "data": {
        "cpus": [
            {
                "cores": 4,
                "mhz": [
                    1808.254,
                    1787.732,
                    1430.044,
                    1845.768,
                    1751.993,
                    1751.121,
                    1769.048,
                    1663.091
                ],
                "model_name": "Intel(R) Core(TM) i7-6700HQ CPU @ 2.60GHz",
                "threads": 8
            }
        ],
        "cpus_stat": [
            0.08386009270965024,
            0.09152542372881356,
            0.10472972972972971,
            0.11295681063122924,
            0.06418918918918919,
            0.09364548494983276,
            0.06397306397306397,
            0.053691275167785234,
            0.0821917808219178
        ],
        "load_average": {
            "fifteen": 1.02,
            "five": 0.84,
            "one": 0.74
        }
    }
}

The first value in the cpus_stat field is the average usage of each cores. The remaining values are the usage for each logical CPU core.

GET /api/memory
{
    "code": 0,
    "data": {
        "memory": {
            "available": 22659469312,
            "buffers": 10412032,
            "cache": 19094446080,
            "free": 4154060800,
            "shared": 119246848,
            "total": 33633140736,
            "used": 10374221824
        },
        "swap": {
            "cache": 385024,
            "free": 4082888704,
            "total": 4094685184,
            "used": 11411456
        }
    }
}

The unit of numbers is bytes.

GET /api/network-detect
{
    "code": 0,
    "data": [
        {
            "download_rate": 0.0,
            "download_total": 55713769,
            "interface": "lo",
            "upload_rate": 0.0,
            "upload_total": 55713769
        },
        {
            "download_rate": 702.0,
            "download_total": 7461474545,
            "interface": "enp0s20f0u4",
            "upload_rate": 1280.6666666666667,
            "upload_total": 331829069
        }
    ]
}

The unit of totals is bytes. The unit of rates is bytes/second.

GET /api/volume
{
    "code": 0,
    "data": [
        {
            "device": "sda2",
            "mount_points": [
                "/",
                "/var/lib/docker/btrfs"
            ],
            "read_total": 7612149760,
            "size": 249809600512,
            "used": 70506823680,
            "write_total": 12919939072
        },
        {
            "device": "sdb1",
            "mount_points": [
                "/storage"
            ],
            "read_total": 7080878080,
            "size": 239938535424,
            "used": 218200993792,
            "write_total": 21799934464
        },
        {
            "device": "sdc2",
            "mount_points": [
                "/home"
            ],
            "read_total": 27511930880,
            "size": 496011051008,
            "used": 370128474112,
            "write_total": 56615944192
        }
    ]
}

The unit of totals is bytes.

GET /api/volume-detect
{
    "code": 0,
    "data": [
        {
            "device": "sda2",
            "mount_points": [
                "/",
                "/var/lib/docker/btrfs"
            ],
            "read_rate": 0.0,
            "read_total": 7612149760,
            "size": 249809600512,
            "used": 70506823680,
            "write_rate": 0.0,
            "write_total": 12928978944
        },
        {
            "device": "sdb1",
            "mount_points": [
                "/storage"
            ],
            "read_rate": 0.0,
            "read_total": 7080878080,
            "size": 239938535424,
            "used": 218200993792,
            "write_rate": 0.0,
            "write_total": 21799934464
        },
        {
            "device": "sdc2",
            "mount_points": [
                "/home"
            ],
            "read_rate": 0.0,
            "read_total": 27511934976,
            "size": 496011051008,
            "used": 370131861504,
            "write_rate": 4965717.333333333,
            "write_total": 56771334144
        }
    ]
}

The unit of totals is bytes. The unit of rates is bytes/second.

GET /api/all
{
    "code": 0,
    "data": {
        "cpus": [
            {
                "cores": 4,
                "mhz": [
                    1200.121,
                    1200.272,
                    1200.12,
                    1200.055,
                    1200.098,
                    1200.034,
                    1200.014,
                    1200.124
                ],
                "model_name": "Intel(R) Core(TM) i7-6700HQ CPU @ 2.60GHz",
                "threads": 8
            }
        ],
        "cpus_stat": [
            0.04951741502308015,
            0.043333333333333335,
            0.030405405405405407,
            0.05743243243243243,
            0.056666666666666664,
            0.04983388704318937,
            0.05387205387205387,
            0.05405405405405406,
            0.05067567567567568
        ],
        "hostname": "magiclen-linux",
        "kernel": "4.15.0-48-generic",
        "load_average": {
            "fifteen": 0.8,
            "five": 0.53,
            "one": 0.28
        },
        "memory": {
            "available": 22578839552,
            "buffers": 10412032,
            "cache": 19104878592,
            "free": 4062957568,
            "shared": 119230464,
            "total": 33633140736,
            "used": 10454892544
        },
        "network": [
            {
                "download_rate": 0.0,
                "download_total": 55798721,
                "interface": "lo",
                "upload_rate": 0.0,
                "upload_total": 55798721
            },
            {
                "download_rate": 9.333333333333334,
                "download_total": 7463048290,
                "interface": "enp0s20f0u4",
                "upload_rate": 28.666666666666668,
                "upload_total": 333465932
            }
        ],
        "rtc_time": {
            "date": "2019-05-03",
            "time": "12:54:34"
        },
        "swap": {
            "cache": 385024,
            "free": 4082888704,
            "total": 4094685184,
            "used": 11411456
        },
        "uptime": 32437,
        "volumes": [
            {
                "device": "sda2",
                "mount_points": [
                    "/",
                    "/var/lib/docker/btrfs"
                ],
                "read_rate": 0.0,
                "read_total": 7612149760,
                "size": 249809600512,
                "used": 70506831872,
                "write_rate": 0.0,
                "write_total": 12939075584
            },
            {
                "device": "sdb1",
                "mount_points": [
                    "/storage"
                ],
                "read_rate": 0.0,
                "read_total": 7080878080,
                "size": 239938535424,
                "used": 218200993792,
                "write_rate": 0.0,
                "write_total": 21799934464
            },
            {
                "device": "sdc2",
                "mount_points": [
                    "/home"
                ],
                "read_rate": 0.0,
                "read_total": 27521441792,
                "size": 496011051008,
                "used": 370118373376,
                "write_rate": 744106.6666666666,
                "write_total": 56883159040
            }
        ]
    }
}
Authorization

If you need expose above HTTP APIs to the Internet. In order to prevent these APIs from being invoked by anyone, you can enable a simple authorization mechanism that is built in this program.

When starting the HTTP server from CLI, you can add a -a <AUTH_KEY> option. Then, every API needs to be invoked by a request which contains a Authorization header to send the AUTH_KEY.

Also, you may want to disable the web page. Just add a --only-api flag.

TODO

  1. Process snapshot (like the ps command)
  2. Terminal monitor (like the top command)
  3. Database Detection
  4. Benchmark (networks)

License

MIT